Moncton Home Sales Hit an Eleven-Year Low Again. Prices Barely Moved.
Two hundred and twenty-nine homes sold in Greater Moncton in September.
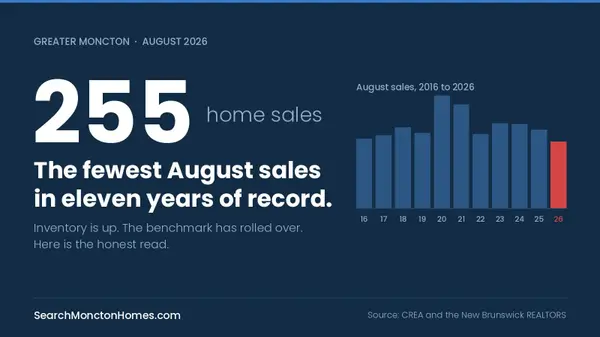
Last month we reported that August was the slowest August in the eleven-year series the board publishes for this region. September has now done the same. At 229 sales, it is the lowest September in the series, below 2017, below 2016 and below every other year on the board's chart. That makes two consecutive months at a series low.
Sellers kept listing anyway. 472 new listings came on in September, the most for any September in that same eleven-year record. For every two homes that came to market, fewer than one sold.
And yet prices barely moved. The benchmark price for a typical home in Moncton and area slipped 0.3% on the month.
When volume falls hard and price hardly moves, the market looks like a standoff: prices holding, buyers stepping back, and listings building up in between. That is the clearest description of Greater Moncton this fall, and this post walks through what it means for you.
Same promise as last month. This is not the sugar-coated version. It is the honest read of the data, including the parts that are not good for our business.
What September looked like
| Metric | September 2026 | Vs September 2025 |
|---|---|---|
| Sales | 229 | −26.1%, from 310 |
| New listings | 472 | +3.1%, from 458 |
| Active listings | 1,575 | +8.7%, from 1,449 |
| Sales-to-new-listings ratio | 48.5 | from 67.7 |
| Months of inventory | 6.9 | from 4.7 |
| HPI benchmark | $377,400 | +0.4% |
| Average price | $367,626 | −3.3% |
| Median price | $360,000 | +1.1% |
| Sale-to-list ratio | 96.2% | from 96.9% |
| Median days on market | 51 | from 53 |
The sales decline has deepened with each of the last three releases: down 5.1% year over year in July, 15.3% in August and 26.1% in September. In dollar terms, roughly $34 million less changed hands in Greater Moncton this September than last.
Not every line is bad. Median days on market came in at 51, slightly quicker than the 53 recorded a year ago. The homes that do sell are not taking longer to sell. There are simply far fewer of them.
Prices held. That is the story.
The MLS Home Price Index prices a constant-quality benchmark home, so it measures value rather than whatever happened to sell that month. In September the composite benchmark was $377,400.
Down 0.3% from August. Down 1.7% from three months ago. Down 6.3% from six months ago.
Read that row from right to left and you can see when the correction happened. Six months ago the benchmark sat around $403,000, so roughly $25,000 has come off since the spring. Most of that drop came in late spring. Over the last three months the benchmark has drifted down by only about $6,500.
Over roughly the same stretch, the year-over-year sales decline went from 5% in July to 26% in September.
Price has stabilised while volume has fallen sharply. That pattern is consistent with buyers stepping back rather than prices adjusting to bring them in.
The year-over-year benchmark figure needs a careful read. It fell from +4.4% in August to +0.4% in September, which looks like a sharp turn. Most of that is last year, not this year. The benchmark jumped about 3.6% between August and September 2025, and this September it slipped 0.3%. Either way the cushion is gone: a benchmark home in Moncton and area is worth about $1,500 more than it was a year ago, which is to say essentially the same.
The other two price measures point in opposite directions. The average fell 3.3% to $367,626, and the median rose 1.1% to $360,000. That split is a mix effect. It tells you what sold, not what homes are worth. For value questions, use the benchmark, and the benchmark says flat.
Standoffs like this end in one of two ways. Either sellers meet buyers on price, or unsold listings expire and come off the market until spring. The next two releases will tell us which way this one breaks.
Listed this summer and still waiting for the right offer?
The buyers still shopping this fall can choose from 1,575 active listings across the region. Find out what your home is worth against the homes actually selling right now. It takes about a minute.
One address. For a closer read on your street or property type, Candace McKay answers directly.
Fewest sales, most new listings
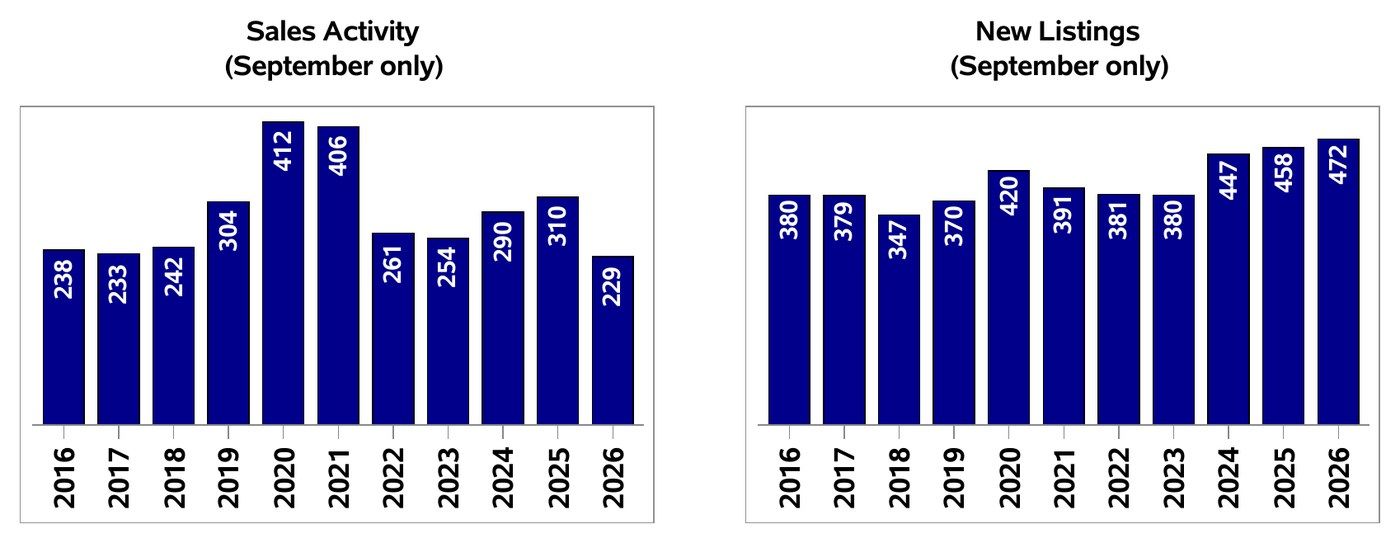
Sales fell to 229, the lowest September in the series, while new listings reached 472, the highest. Chart: CREA and the New Brunswick REALTORS.
Look at the two charts together. In September 2020, 420 homes listed and 412 sold. This September, 472 listed and 229 sold.
The sales-to-new-listings ratio landed at 48.5, down from 67.7 a year ago and the lowest September reading in the eleven-year record. By the commonly cited industry range, a ratio between 40 and 60 indicates a balanced market, below 40 favours buyers and above 60 favours sellers. A year ago Moncton read 67.7, seller territory. It now sits in the lower half of the balanced range, and it got there in twelve months.
Year to date, the region has recorded 4,332 new listings, more than in the first nine months of any year in the series. Sales over the same period total 2,368, the fewest since 2018.
Six point nine months
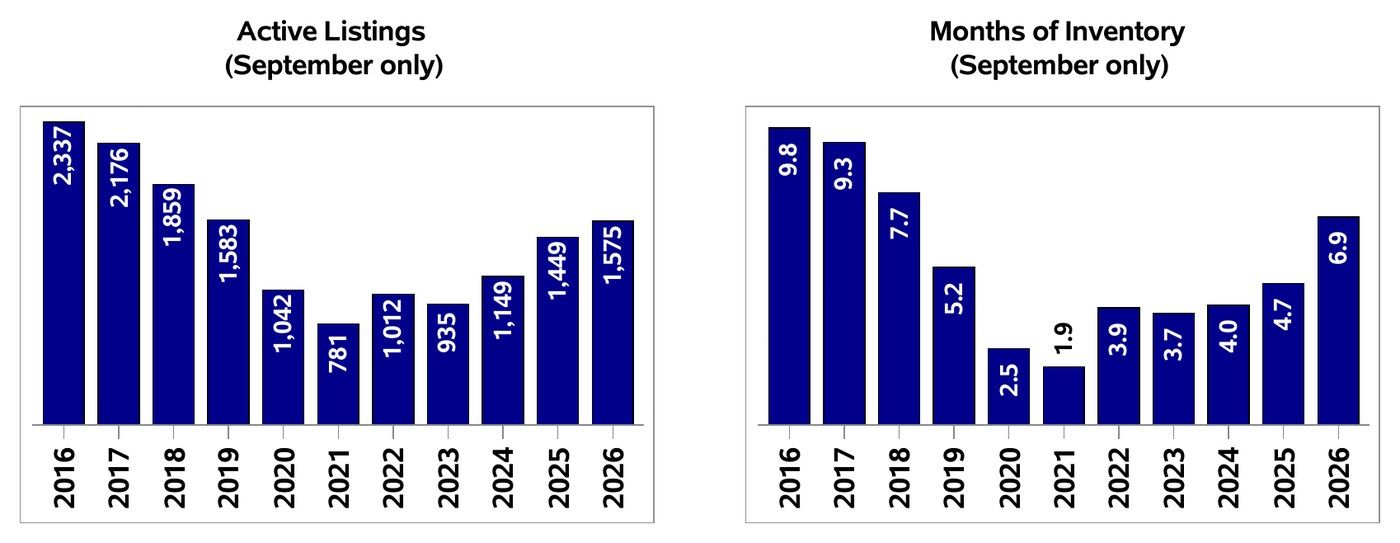
Active listings reached 1,575 and months of inventory hit 6.9, the highest September reading since 2018. Chart: CREA and the New Brunswick REALTORS.
Months of inventory answers one question: if nothing new came to market, how long would it take to sell everything already listed at the current pace? In September 2021 the answer was 1.9 months. Last month it was 6.2. This month it is 6.9.
That is the highest September reading since 2018, when it was 7.7. Active listings at 1,575 are the most for a September since 2019 and almost exactly level with that year. They are also about a third below 2016, when this region carried close to ten months of supply.
So the market has not returned to 2016. In inventory terms it is back around 2018 and 2019: a normal Maritime market, where the right house at the right price sells and an overpriced one waits.
The province says sellers. Moncton does not.
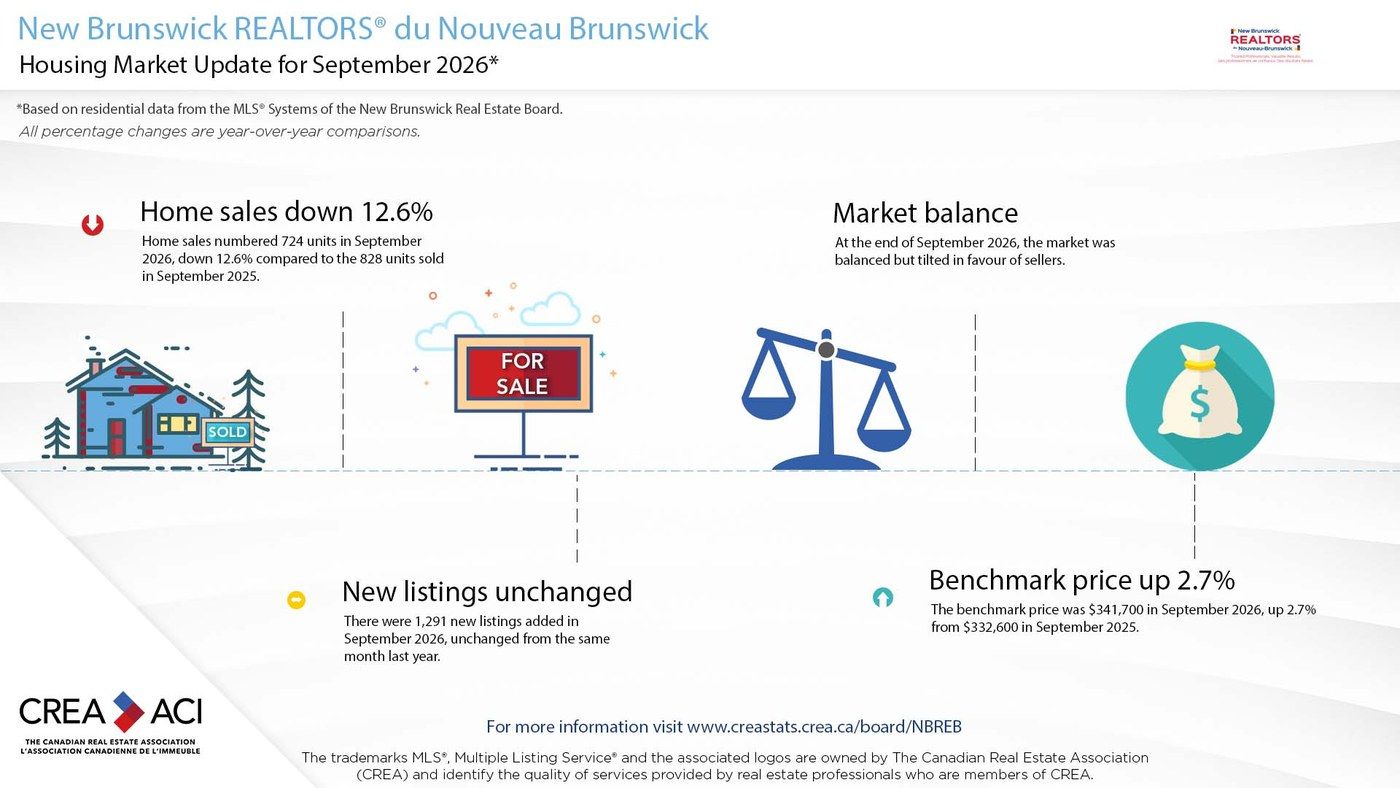
The board's province-wide summary for September. Every figure in this graphic covers all of New Brunswick, not Moncton and area. Graphic: CREA and the New Brunswick REALTORS.
The board's province-wide summary for September reads: sales down 12.6%, benchmark up 2.7%, and a market that is "balanced but tilted in favour of sellers."
That is accurate for New Brunswick as a whole. It does not describe Greater Moncton.
Take Moncton and area out of the provincial totals and the rest of New Brunswick sold about 4% fewer homes than last September. Moncton sold 26.1% fewer. Of the roughly 100 sales the province lost year over year, close to four in five were lost here. The provincial benchmark is up 2.7% on the year, and Moncton's is up 0.4%. On actual, unadjusted figures the province is carrying about 5.6 months of inventory (the board's seasonally adjusted figure is 5.2), and Moncton is carrying 6.9.
This fall, Moncton is cooling considerably faster than the rest of the province. Anyone reading provincial averages, whether an out-of-province buyer, an investor or a Moncton seller, should keep that in mind.
Last month's tightest segment is not tight anymore
In August, semi-detached homes were the tightest part of this market: 3.2 months of inventory, year-to-date sales up 28.5%, and a sales-to-new-listings ratio of 94.2. We told semi owners who had been waiting to look hard at this fall, because there was no guarantee that strength would hold.
It held for about a month.
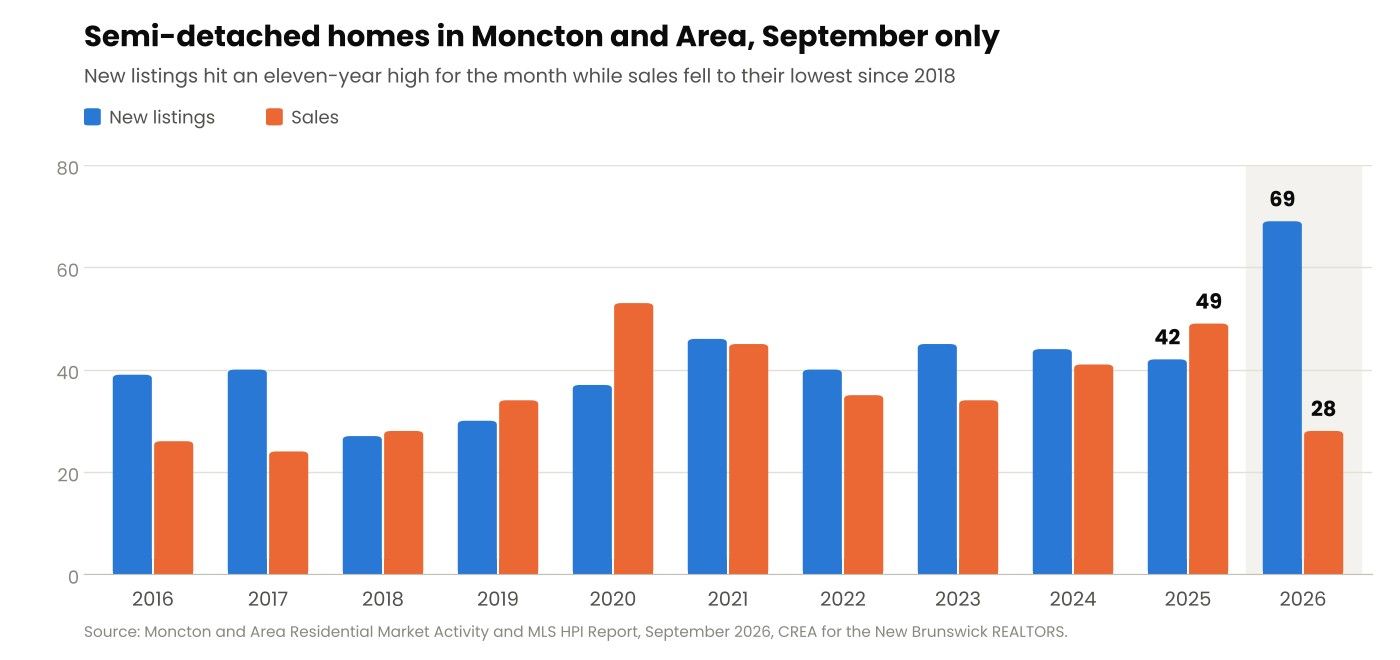
Semi-detached new listings reached 69 in September, half again above the previous September high of 46 in 2021. Chart: SearchMonctonHomes.com, from CREA data for the New Brunswick REALTORS.
69 semi-detached homes came to market in September, the most for any September in the eleven-year record by a wide margin. 28 sold. Months of inventory for the segment jumped from 3.2 to 6.2 in a single month, matching 2018 and now close to the market-wide 6.9. The median semi took 55 days to sell, against 39 a year ago.
Two caveats keep this honest. First, September 2025 was an unusually strong month for semis, with 49 sales, second only to 2020, so the 42.9% year-over-year drop overstates the slowdown. Second, 28 sales is a small number and one month is not a trend. Year to date, semi-detached sales are still up 17.6%.
What the data does show clearly is the supply surge. The board package does not say whether those 69 listings are new construction reaching completion or owners trying to sell into last month's strength. Either way, semi buyers now have choice they did not have in August.
Detached homes: fewer buyers, not more sellers
Single detached homes carry most of this market, and the September numbers for that segment are worth reading closely.
171 detached homes sold, down 22.3% and the lowest September for the segment in the series. Months of inventory rose to 6.4, from 4.8 a year ago. The detached benchmark sits at $386,300, down 0.4% on the month and up just 0.1% on the year.
What did not happen is a rush of detached sellers. Detached new listings were down 1.8% from last September, and year to date they are down 4.5%. Active detached listings are up only 2.6%. The pressure in this segment is coming from the buyer side.
The detached median sale price fell 5.8% to $352,000 while the benchmark held flat. That gap is a mix effect again. It suggests the detached homes that did sell skewed toward the more affordable end of the segment.
Well-priced detached homes are still selling quickly. The median detached sale took 46 days in September, a week faster than the 53 days it took a year ago.
Where the benchmark sits by property type
| Property type | Benchmark | Vs 1 month | Vs 12 months | Sept sales | Months of inventory |
|---|---|---|---|---|---|
| Composite | $377,400 | −0.3% | +0.4% | 229 | 6.9 |
| Single detached | $386,300 | −0.4% | +0.1% | 171 | 6.4 |
| Semi-detached | $370,300 | −0.5% | +3.2% | 28 | 6.2 |
| Townhouse | $286,800 | +3.0% | +16.8% | 11 | 6.6 |
| Apartment | $311,800 | −0.6% | −8.9% | 1 | 36.0 |
Benchmarks and months of inventory are the September 2026 readings. Property-type sales do not add up to the composite total, which also includes other residential types.
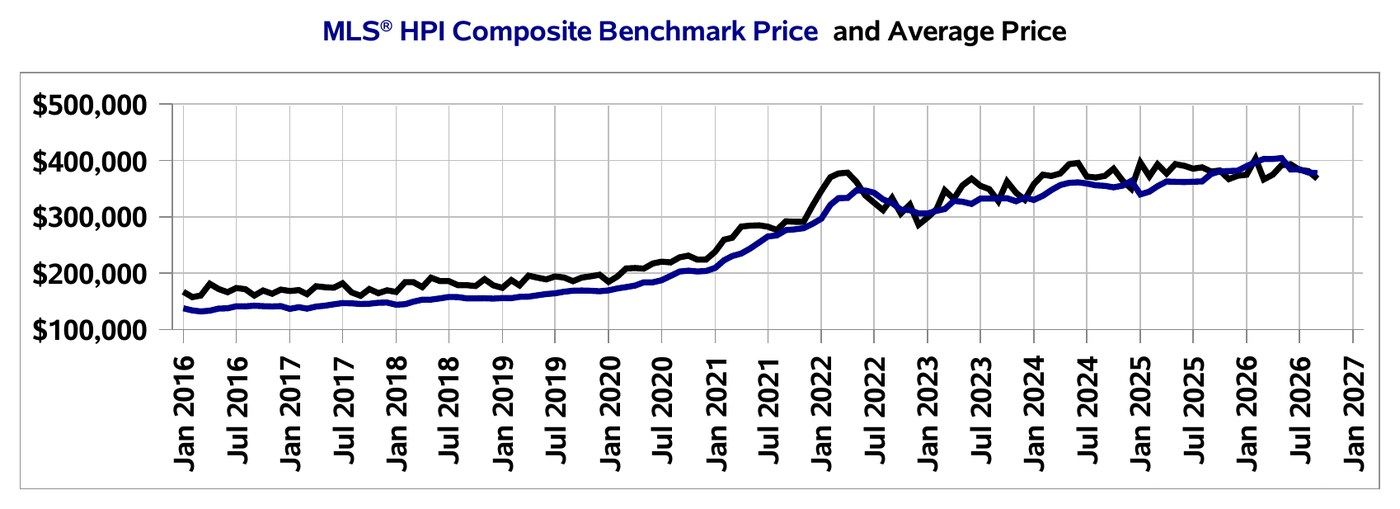
The benchmark, in blue, peaked in the spring and has levelled off since. The average, in black, moves around it with the mix of homes that sold. Chart: CREA and the New Brunswick REALTORS.
The same two cautions as last month apply to the small segments. Townhouses carry the strongest benchmark gain in the release, up 16.8% on the year, but the segment sold 11 homes in September and sits at 6.6 months of inventory. That is a strong index resting on a thin and slow market. Apartments recorded one sale in September. Their 36 months of inventory is 36 listings divided by that single sale, and it does not support any conclusion.
What this means for Moncton and area
Volume is breaking before price. Volume often adjusts before price when a market turns. Owners tend to anchor to what their home was worth a season ago, buyers wait for a reason to move, and transactions slow while prices hold. Sales declines that deepened across three releases, alongside a benchmark that slipped less than 2% over the same period, fit that pattern.
Supply is not slowing down. More homes have come to market in the first nine months of 2026 than in the same period of any year in the series, and semi-detached new listings just set a September record. Add the development planned across the region, from the Riverview secondary plan to the Dieppe Boulevard corridor, and there is little sign of supply tightening soon.
Long-term owners are in a strong position. The composite benchmark is up 13.5% over three years and 36.5% over five. A benchmark home bought in September 2021 is worth roughly $100,000 more today. A softening market changes negotiations, but it does not undo that gain.
This is not a crash. Active listings are about a third below 2016. On average, sales still closed within 3.8% of asking. The benchmark is level with a year ago. Greater Moncton is rebalancing after several years of seller-favoured conditions, and it is doing so faster than the rest of the province.
October will tell us a lot. If new listings keep running at record levels while sales stay near record lows, months of inventory moves past seven and the pressure on prices builds. If listings start expiring and coming off the market for the winter, inventory tightens and the standoff carries into spring. We will report it the same way either way.
If you are selling right now
About a quarter fewer homes sold this September than last, while the number of homes competing for buyers grew. Price for the buyers who are still shopping, not for the ones who were here in the spring.
The data shows that pricing right still works. Detached homes that sold in September went in a median of 46 days, faster than last year. In our experience, the listings that sit are usually the ones still priced against spring comparables.
Plan for negotiation. On average, sales closed 3.8% under asking in September. On a $380,000 listing that is roughly $14,000. Build that into your number before you list rather than discovering it at the offer.
If you are thinking of waiting for spring, that is a reasonable plan only if your price will be right for spring. It does not avoid competition. Listings that do not sell this fall will likely come back to market in the spring alongside every other seller who waited.
If you own a semi-detached home, the advantage we described last month has shrunk. Your segment now has 174 active listings, up 21.7% on last September and at least double every September from 2020 to 2024. The segment's benchmark is still up 3.2% on the year, so your price position is fine, but you no longer have scarcity on your side. Our sellers guide covers how to prepare for a market like this one.
If you are buying right now
For buyers, this is the most supply relative to sales Greater Moncton has seen in any September since 2018. Use it deliberately.
You have choice. Over 1,500 active listings and close to seven months of supply means you can see a home twice and compare it properly. If you were looking at semi-detached homes in August and found nothing, look again. That segment went from 3.2 to 6.2 months of inventory in a single month.
You have room to negotiate. The average sale closed 3.8% under asking, and a listing that has sat since the summer often has more room than that. Ask how long a home has been listed and whether the price has already been reduced.
You can keep your conditions. In September 2021, homes here sold for more than their asking price on average, and in a market like that, conditions are the first thing buyers give up to compete. In this one, a seller facing 6.9 months of competing supply has every reason to accept a conditional offer. Do not give that protection away.
Do not wait for a collapse. The benchmark has moved only 1.7% in three months. Prices are not falling quickly, so most of your advantage right now comes from negotiation and terms rather than from waiting for lower prices. Our buyers guide walks through the process, and you can browse what is on the market in Moncton today.
How we can help
A regional benchmark tells you what happened to the market. It does not tell you what happened on your street, in your property type or in your price range. In a month where semis flipped from scarce to plentiful and detached sales hit a series low, that difference is worth real money on either side of the deal.
Find out where your home actually sits
If you are selling this fall, we price against the last thirty days of comparable sales in your area, not a regional average. If you are buying, we will show you which listings have real motivation behind them and which sellers are still anchored to the spring.
Or reach out to Candace McKay for a read on your specific street, property type and timeline.
Full tables, year-to-date figures and the complete benchmark series by property type are on our Moncton average home price page, updated with every monthly release. Last month's analysis is in the August 2026 Moncton market update.
Source: Moncton and Area Residential Market Activity and MLS Home Price Index Report, September 2026, and the New Brunswick residential housing activity report for September 2026, both prepared for the New Brunswick REALTORS by the Canadian Real Estate Association. Moncton figures cover the Moncton and Area board region, which includes Moncton, Dieppe, Riverview and surrounding communities. The package reports the region as a single market and contains no municipal breakdown. Province-wide figures cover all of New Brunswick. Figures for New Brunswick excluding Moncton and area, implied benchmark values and dollar differences are our own arithmetic from the published reports. Historical comparisons cover 2016 to 2026, the full range published in the release.
Categories
Recent Posts