Moncton Real Estate Market Update July 2026
Moncton sellers listed 569 homes in July, the most in any July in at least a decade. Buyers bought 316, the fewest since 2023.
That gap is the story of this market right now, and it is why almost every measure of market balance loosened this summer. What makes July interesting is that prices did not follow.
The widest gap between listing and selling in a decade
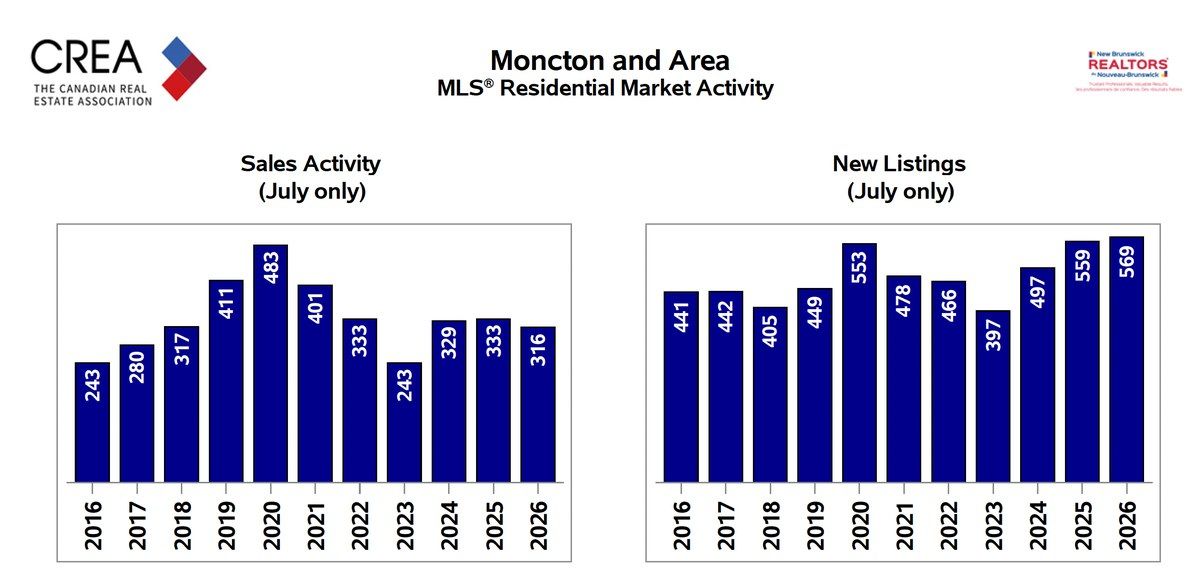
New listings reached 569 in July 2026, the highest of any July in the series, while sales fell to 316. Chart: CREA and the New Brunswick REALTORS.
Look at the two panels together. New listings have climbed every year since 2023 and have now passed the 2020 peak. Sales peaked at 483 in 2020 and have been drifting since.
The ratio between them, what the board calls the sales-to-new-listings ratio, came in at 55.5. That is the lowest reading since 2016. In 2019 it was 91.5, meaning nine homes sold for every ten listed. Today it is closer to five and a half.
Nothing about that is a crash. It is the ordinary mechanics of a market where supply has arrived faster than demand can absorb it, for the first time in about ten years.
The month in one table
| Metric | July 2026 | Vs July 2025 |
|---|---|---|
| Sales | 316 | −5.1% |
| New listings | 569 | +1.8% |
| Average price | $383,611 | −0.5% |
| Median price | $362,000 | +2.0% |
| HPI benchmark | $384,300 | +6.1% |
| Months of inventory | 4.9 | up from 4.5 |
| Median days on market | 38 | up from 33 |
| Sale-to-list ratio | 97.0% | down from 97.9% |
Wondering where your home sits in this
A regional benchmark describes the market, not your address. If the gap between these numbers matters to a decision you are weighing, start with what your own property is worth today.
One address, about a minute. For a closer read on your street or property type, Candace McKay answers directly.
So why did values go up?
Because the average price and the value of a home are not the same thing, and this month they moved in opposite directions.
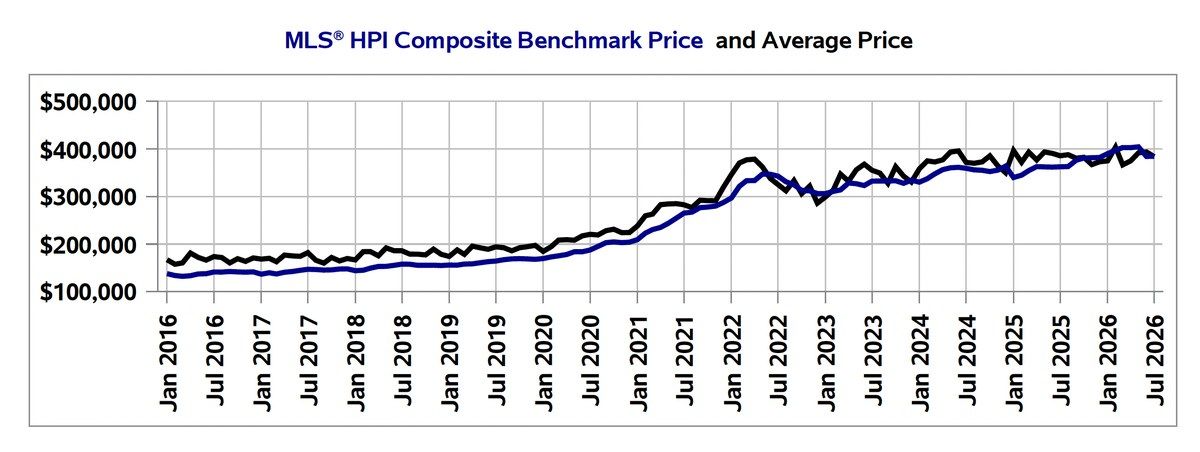
The jagged black line is the average price, month to month. The smooth blue line is the MLS HPI benchmark. Chart: CREA and the New Brunswick REALTORS.
The average price is the mean of everything that sold, so it jumps around with the mix. That is the jagged line. The MLS Home Price Index tracks a constant-quality benchmark home instead, the same size, age and features every month, so it isolates value from mix. That is the smooth one.
In July the average fell 0.5% to $383,611 while the benchmark rose 6.1% to $384,300. The median, up 2.0%, sides with the benchmark.
Read together, they say something specific: comparable homes are worth meaningfully more than a year ago, and the sales mix has shifted toward the lower end of the market. More entry-level homes traded, which pulls the average down without any individual house being worth less.
This matters practically. A seller pricing to a falling regional average will underprice a home whose benchmark is up 6.1%. A buyer waiting for the average to signal a better entry point is watching the wrong number.
Notice also how the two lines have converged. For most of the past decade the average sat well above the benchmark. They are now essentially on top of each other, which is what happens when the unusual, high-end sales that used to stretch the average stop dominating the mix.
Supply has normalised, it has not overshot
This is where the ten-year view earns its place, because 4.9 months of inventory means something very different depending on what you compare it to.
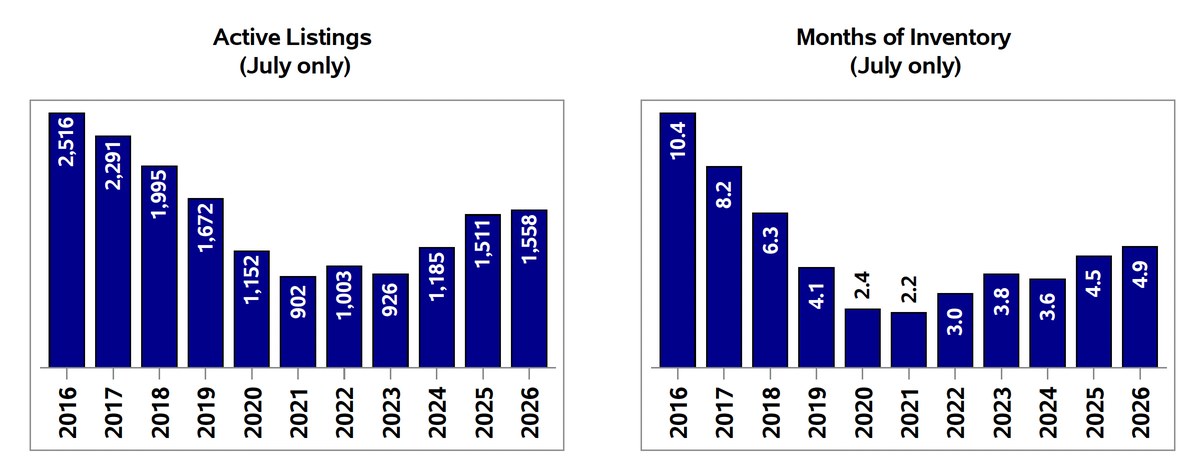
Active listings and months of inventory, July only, 2016 to 2026. Chart: CREA and the New Brunswick REALTORS.
Against 2021, when inventory hit 2.2 months and there were only 902 homes on the market, today looks loose. Against 2016, when there were 2,516 active listings and 10.4 months of supply, it looks tight.
Both comparisons are fair, and together they explain the whole thing. Active listings at 1,558 are the highest since 2019, and inventory at 4.9 months is the highest since 2018. But 1,558 is still roughly 38% below where the market sat in 2016, and the average price has more than doubled since then.
That is why prices have not fallen. The market has rebalanced out of a genuine shortage, but it has not tipped into oversupply. Buyers have leverage they did not have three years ago, and sellers still have a floor under them.
One market, two very different stories
The part almost nobody reports is how far the property types have separated.
| Property type | Benchmark | Vs 12 months | Months of inventory |
|---|---|---|---|
| Townhouse | $275,100 | +17.8% | 3.3 |
| Single detached | $394,000 | +6.2% | 4.7 |
| Semi-detached | $375,000 | +6.0% | 4.0 |
| Apartment | $331,500 | −6.6% | 13.5 |
Roughly 24 percentage points separate the strongest segment from the weakest, inside one market, over a single year.
Townhouses are the tightest thing in Greater Moncton. Sales rose 26.3% year over year, the benchmark is up 17.8%, and at 3.3 months of inventory it is the only segment tighter than the market as a whole. That is what happens when demand for lower-priced, lower-maintenance ownership runs ahead of supply.
Apartments sit at the other end, benchmark down 6.6% with 13.5 months of inventory. Worth stating plainly: that segment recorded 2 sales in July and 17 so far this year. A monthly average built on two transactions is noise and should not be read as a trend. The index carries more weight than that average, but the segment is thin.
Semi-detached is the quiet one to watch. The benchmark is up 6.0%, right in line with the market, but inventory went from 2.6 months to 4.0 and median days on market stretched from 32 to 54. Values are holding while the segment loosens underneath them.
What it means going into the fall
If you are buying, this is the most choice you have had since 2019, and the negotiating position is real. The sale-to-list ratio fell to 97.0%, its weakest since 2019, and homes are taking five days longer to sell. Just do not read the falling average as falling values. The benchmark says the opposite, and the segment you shop in matters more than the regional headline.
If you are selling, price to the benchmark for your property type and to genuine comparables, not to an average being dragged down by the mix. Plan for a longer process: 38 days is the median and semi-detached is running well past that. With 569 homes listed in a single month, standing out is now a pricing and presentation problem, not a scarcity advantage.
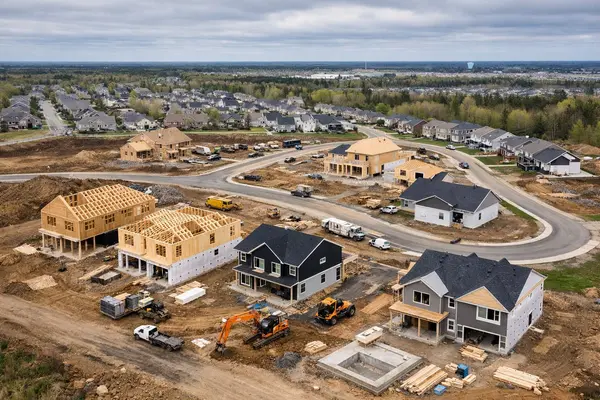
What to watch: whether new listings keep climbing into the fall. Greater Moncton also has a large volume of new housing in the pipeline, from the Riverview secondary plan to the Dieppe Boulevard corridor and the broader new construction pipeline. What that 4.9 does as new supply completes is the real question for 2027.
Full tables, including year-to-date figures and the complete benchmark series, are on our Moncton average home price page, updated with every monthly release.
Source and charts: Moncton and Area Residential Market Activity and MLS Home Price Index Report, July 2026, prepared for the New Brunswick REALTORS by the Canadian Real Estate Association. Figures cover Moncton and Area, which includes Moncton, Dieppe, Riverview and surrounding communities, and excludes the Saint John, Fredericton and Northern and Valley regions. The package reports the region as a single market and contains no municipal breakdown.
Categories
Recent Posts