Moncton & Area Real Estate Market - Update March 2026

Moncton & Area Real Estate Market Update, March 2026
The March 2026 numbers from the Canadian Real Estate Association are in, and they confirm what many in the Greater Moncton market have been sensing since the start of the year. Sales activity is cooling, prices are softening, and inventory is climbing back toward levels we have not seen since before the pandemic. For buyers, sellers, and investors tracking this market, the data tells a clear story about where things stand heading into spring.
This is not a crash narrative. The Moncton and area market recorded 222 residential sales in March 2026, with an average price of $367,115 and 4.9 months of inventory. Compared to the frenzy of 2021, when 424 homes sold in March at 1.5 months of inventory, we are now operating in a structurally different environment. The question is whether this is a pause or the beginning of a longer correction cycle, and the answer depends on how you read the supply side.
March 2026 Key Metrics at a Glance
Here is how the Moncton and area market performed in March 2026, based on MLS data from CREA and the New Brunswick REALTORS Association.
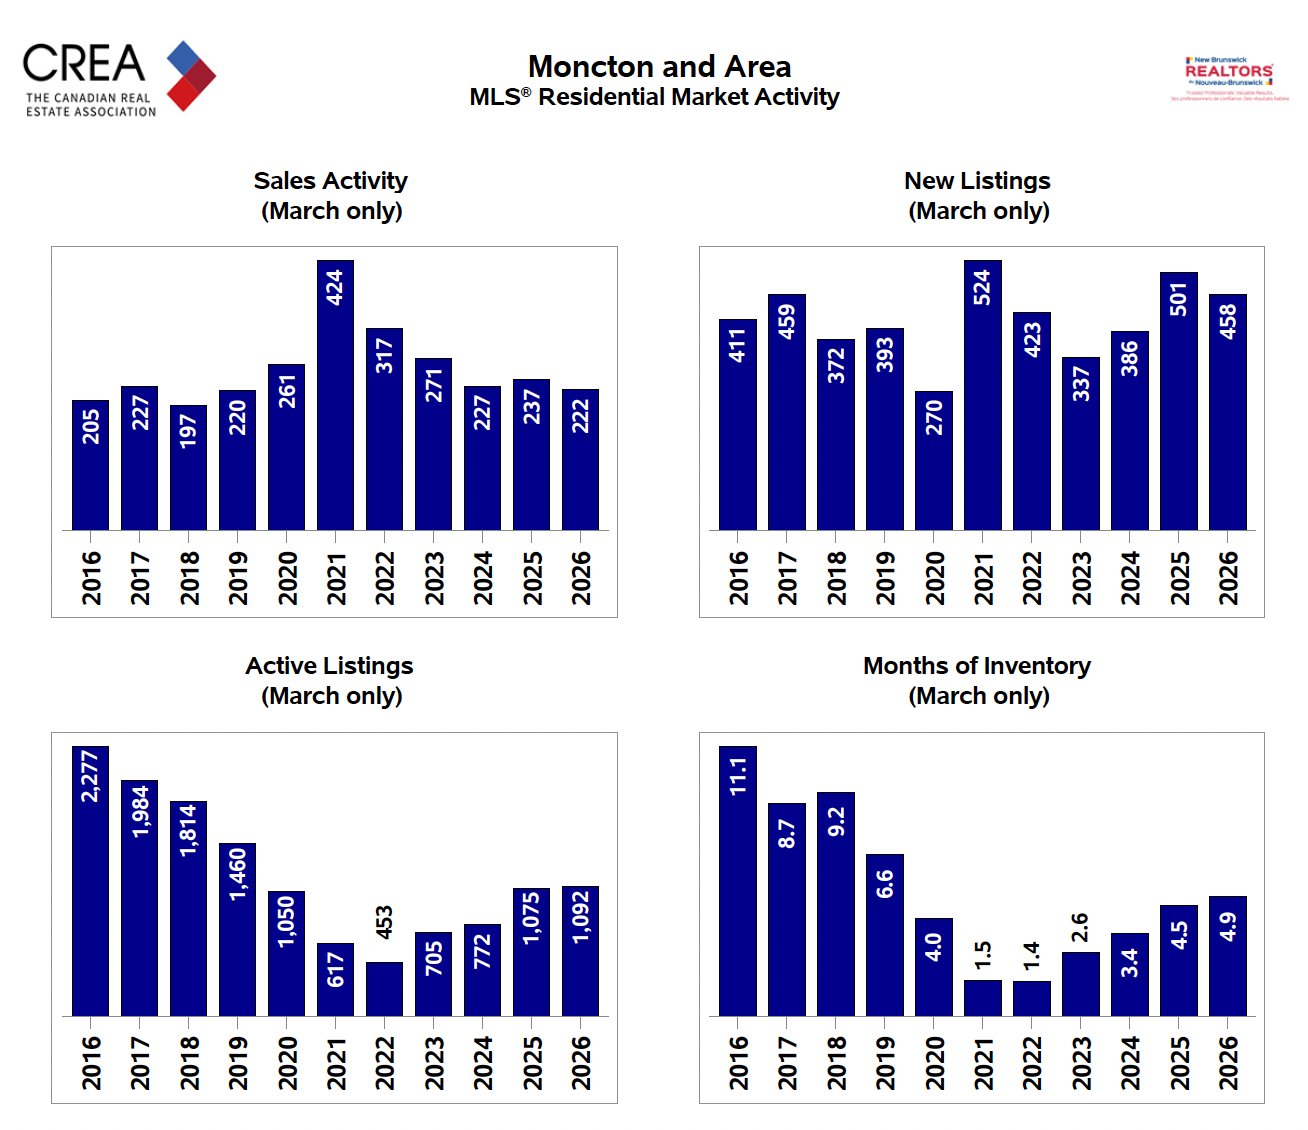
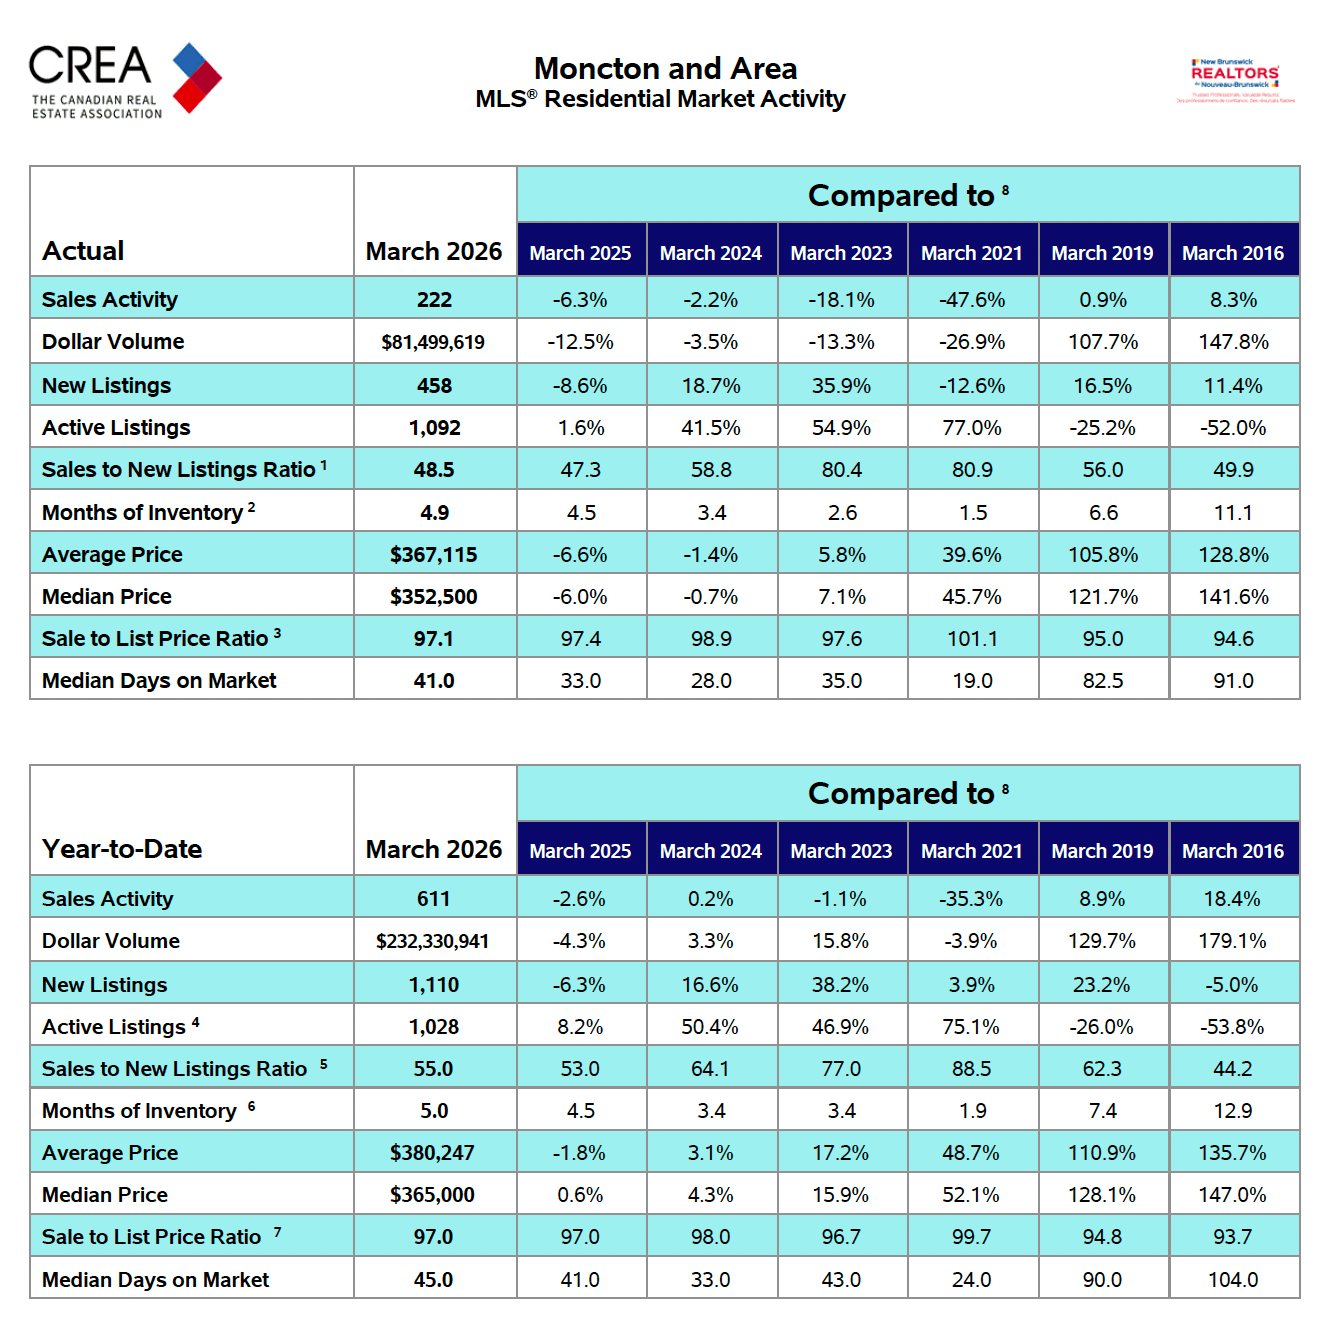
Sales Activity: 222 transactions, down 6.3% from March 2025 (237) and down 2.2% from March 2024 (227). This marks the lowest March sales figure since 2018, when 197 homes changed hands. For context, the 10-year peak was 424 sales in March 2021.
Dollar Volume: $81,499,619, down 12.5% year-over-year. The steeper decline in dollar volume versus sales activity signals that the average transaction value is pulling back.
New Listings: 458, down 8.6% from March 2025 (501) but up 18.7% from March 2024. The simultaneous decline in both new listings and sales activity means supply is growing slowly, not flooding the market.
Active Listings: 1,092, up 1.6% from March 2025 (1,075) and up 41.5% from March 2024 (772). This is the highest March active listing count since 2019 (1,460), though still well below the 2016 peak of 2,277.
Months of Inventory: 4.9, up from 4.5 in March 2025 and 3.4 in March 2024. The market is approaching balanced territory (generally defined as 5 to 7 months). By comparison, the 2021 low was 1.5 months and the 2016 high was 11.1 months.
Average Price: $367,115, down 6.6% from March 2025 ($392,832) and down 1.4% from March 2024. The year-to-date average sits at $380,247, down 1.8% from the same period last year.
Median Price: $352,500, down 6.0% year-over-year. The year-to-date median is $365,000, which is essentially flat (up 0.6%) versus 2025.
Sale to List Price Ratio: 97.1%, down slightly from 97.4% in March 2025. Buyers are negotiating roughly 3% off asking, which is in line with a balanced market but a far cry from the 101.1% over-ask environment of March 2021.
Median Days on Market: 41 days, up from 33 in March 2025 and 28 in March 2024. Homes are taking noticeably longer to sell. In March 2021, the median was 19 days.
Single Detached Homes: The Softening is Steeper
The single detached segment saw sharper declines than the overall market. Sales dropped 12.6% year-over-year to 159 transactions. Dollar volume fell 20.5% to $58,410,320. The average price for single detached homes came in at $367,361, down 9.0% from March 2025, while the median price declined 13.0% to $337,500. New listings dropped 17.2% to 328, and active listings fell 7.8% to 770. Days on market stretched to 43, up from 37 a year ago.
Year-to-date, single detached sales activity is down 12.2% at 426 transactions, with an average price of $386,121 (down 1.7%). The median YTD price of $360,000 is flat year-over-year. The single detached segment is bearing the brunt of the correction, particularly at higher price points where buyer sensitivity to interest rates is most acute.
Why It Matters for Real Estate in Greater Moncton
The March data represents a meaningful acceleration of trends that have been building since mid-2025. Three dynamics are converging. First, the months of inventory at 4.9 is the highest March reading since 2019, signalling that the supply-demand imbalance that drove prices up 129% since 2016 is unwinding. Second, the sales-to-new-listings ratio at 48.5 sits firmly in buyer's market territory (below 40% is a strong buyer's market, 40 to 60% is balanced). Third, the gap between average price declines (-6.6%) and median price declines (-6.0%) suggests that the upper end of the market is softening faster than the entry-level segment.
It is worth putting this in a decade-long context. Despite the recent pullback, the average price of $367,115 is still 105.8% above March 2019 ($178,400 adjusted) and 128.8% above March 2016 ($160,400 adjusted). Prices are correcting from elevated levels, not collapsing to pre-boom norms. The structural floor is supported by continued in-migration to New Brunswick and historically low rental vacancy rates in the Moncton CMA (3.8% as of October 2025, up from 1.2% in 2023 but still tight by historical standards).
What It Means for Buyers and Sellers
For buyers: The negotiating leverage is the best it has been since 2019. With 41 median days on market and a 97.1% sale-to-list ratio, there is room to make conditional offers, negotiate on price, and take time with due diligence. The year-to-date median price of $365,000 remains a fraction of what comparable homes cost in Halifax, Ottawa, or Toronto. First-time buyers who were priced out during the 2021-2022 frenzy should be looking closely at this window, particularly in the single detached segment where price declines are steepest.
For sellers: Pricing strategy is everything in this market. The 6.6% year-over-year decline in average price means that comparable sales from even six months ago may overstate what your home is worth today. Listings priced at or slightly below current comparables are still selling. Listings priced at 2024 levels are sitting. With 1,092 active listings competing for 222 buyers in March, overpricing by even 5% can cost you months of carrying costs and ultimately a lower sale price.
Local Insight
What stands out most in the March data is not any single number, it is the speed of the shift. Twelve months ago, the market was debating whether we had reached a plateau. Now the data is unambiguous: we are in a correction, concentrated in the single detached segment and most pronounced at higher price points. The 13% decline in the single detached median price is the sharpest monthly year-over-year drop in the current cycle.
But corrections are not uniform. Entry-level properties under $350,000, particularly condos, semis, and townhomes, are holding value better because demand at that price point is less sensitive to rate changes and more supported by first-time buyers and newcomers. The investment thesis for Greater Moncton remains intact. Population growth is steady, new construction is diversifying (multi-unit, ADUs, missing middle), and the cost-of-living advantage versus larger Canadian cities continues to attract interprovincial migrants.
If you are sitting on the sidelines waiting for a bottom, the data suggests we are closer to a stabilization than a freefall. Year-to-date median prices are essentially flat. The correction is concentrated in monthly average figures, which are more sensitive to the mix of homes selling in any given period. Strategic buyers and investors should be watching the months-of-inventory trend closely. If it crosses 6.0 by summer, that signals a deeper shift. If it plateaus near 5.0, we are likely looking at a soft landing.
Year-to-Date Performance Summary
Through the first three months of 2026, the market has recorded 611 sales (down 2.6% from 2025), generating $232.3 million in dollar volume (down 4.3%). Active listings average 1,028 (up 8.2%), and the year-to-date months of inventory sits at 5.0. The YTD average price of $380,247 is down 1.8%, while the YTD median of $365,000 is up 0.6%, suggesting the broader pricing trend is more stable than the March-specific figures imply.
The sales-to-new-listings ratio year-to-date is 55.0, which remains in balanced territory. Median days on market is 45, up from 41 a year ago. The sale-to-list ratio of 97.0% year-to-date is virtually unchanged. What the YTD numbers tell us is that while March represented an acceleration of the cooling trend, the first quarter as a whole has been characterized by a gradual moderation rather than an abrupt downturn.
10-Year Structural Context
Looking at the 10-year March-only data, the trajectory becomes clearer. Sales activity has been range-bound between 197 and 271 in every year except 2020-2021 (the pandemic surge to 261 and 424 respectively) and the post-surge normalization of 317 in 2022. At 222, March 2026 sits in the lower half of the historical range. Active listings at 1,092 have recovered to roughly 2019 levels (1,460) but remain well below the 2016 peak of 2,277. Months of inventory at 4.9 is the highest since 2019 (6.6) but still below the buyer's market threshold of 7+ months.
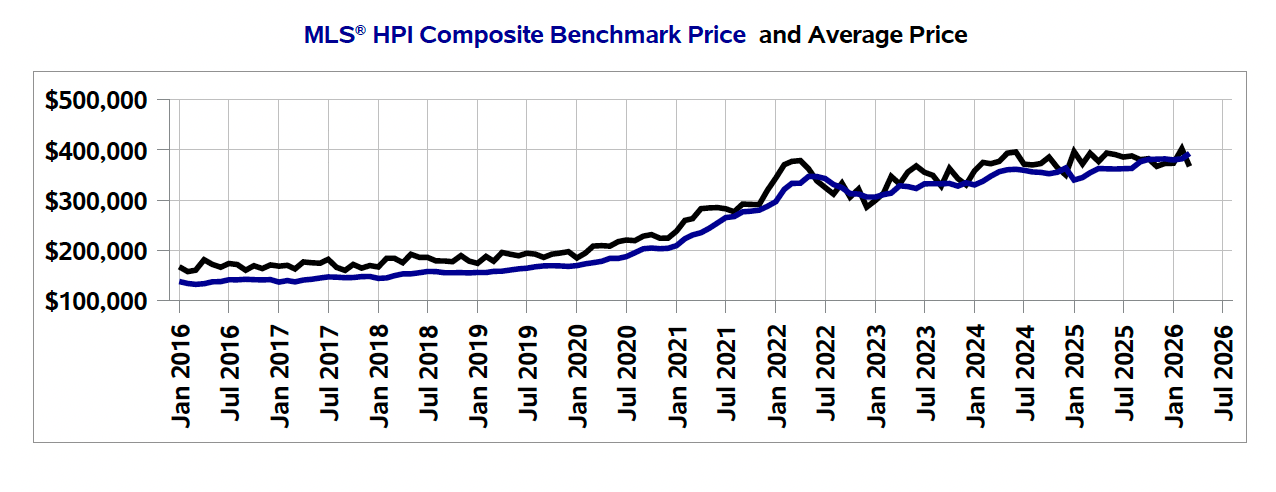
The MLS HPI Composite Benchmark Price chart shows prices stabilizing in the $380,000 to $390,000 range since mid-2025, with the average price tracking close to the benchmark. This convergence suggests that the speculative premium that pushed prices above fundamentals during 2021-2022 has largely been absorbed. What remains is a market priced by migration-driven demand, local employment fundamentals, and borrowing costs.
Ready to Make a Move?
Whether you are buying, selling, or investing in Greater Moncton real estate, understanding the numbers is only half the equation. The other half is timing, positioning, and local expertise.
Browse homes for sale in Moncton, Dieppe, and Riverview
Check your home value with a free market evaluation
Contact Joel Langlois to discuss your next move
Joel Langlois | Moncton Real Estate
Local expertise • Data-driven pricing • Strategic marketing
Looking to invest in Moncton or Dieppe real estate? Get a targeted analysis of available multi-family and investment properties.
Book an investment consultation with Joel Langlois: sellingwithjoel@gmail.com
Data source: Canadian MLS Systems, CREA. Prepared for the New Brunswick REALTORS du Nouveau Brunswick by the Canadian Real Estate Association. All present and historical information contained within this report is based on the full set of data collected on the first calendar day of the month, and cannot be directly compared to previous reports due to possible revisions in the data.
Disclaimer: The information provided in this blog post is for general informational purposes only and should not be construed as financial or investment advice. Market conditions can change rapidly. Consult with a qualified real estate professional and financial advisor before making any real estate decisions.
Categories
Recent Posts