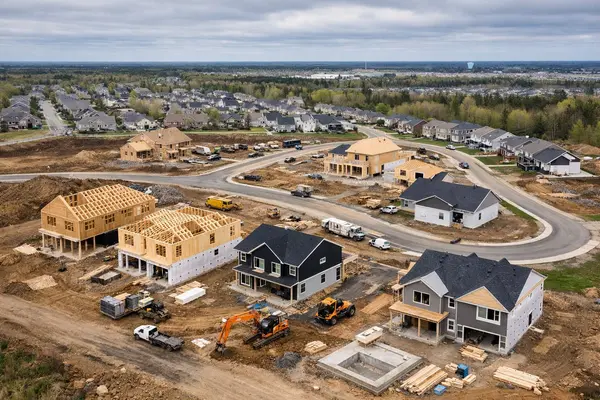
Moncton Just Had Its Slowest August in Eleven Years
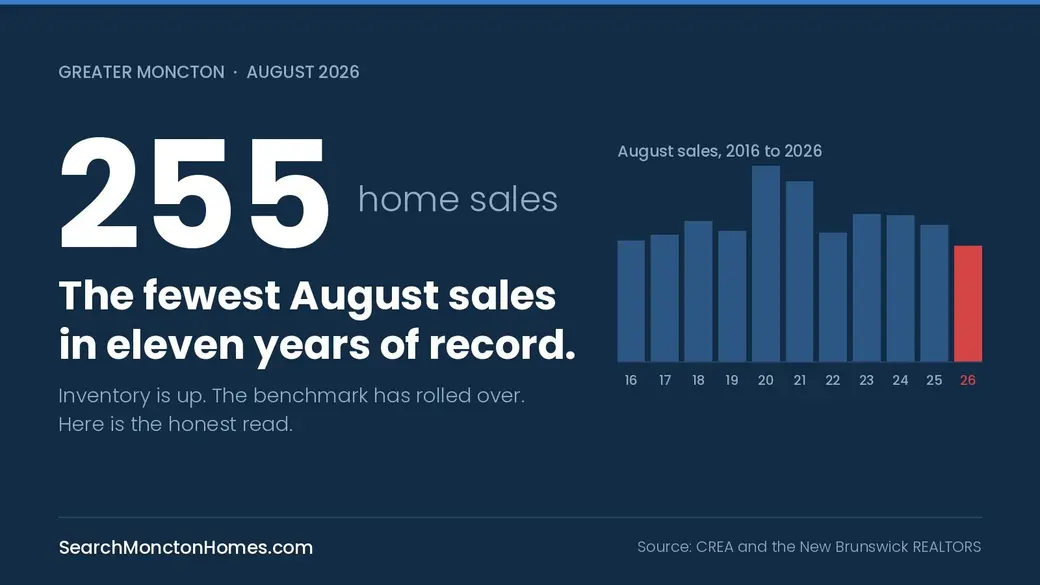
Two hundred and fifty-five homes sold in Greater Moncton in August.
That is the fewest August sales in the eleven years CREA publishes for this region. Fewer than 2016, when inventory here sat at nine months and nothing moved. Fewer than 2022, when rates were climbing at almost every Bank of Canada decision. Fewer than any August in the record.
Meanwhile 461 new listings came on, the second-highest August in that same eleven-year series.
You do not need a model to work out what happens when those two lines move in opposite directions.
So let us be clear about what this article is. It is not the version where we tell you the market is balanced, healthy and full of opportunity and leave it at that. August was a poor month for anyone selling a detached home in Greater Moncton, and the data says so in four separate places. You are better off hearing that here than discovering it on day sixty of your listing.
What follows is the honest read, including the parts that are not good for our business.
What August looked like
| Metric | August 2026 | Vs August 2025 |
|---|---|---|
| Sales | 255 | −15.3%, from 301 |
| New listings | 461 | +7.5%, from 429 |
| Active listings | 1,585 | +6.3%, from 1,491 |
| Average price | $374,090 | −3.5% |
| Median price | $357,000 | −1.6% |
| HPI benchmark | $378,700 | +4.4% |
| Months of inventory | 6.2 | from 5.0 |
| Sale-to-list ratio | 96.6% | from 97.0% |
| Median days on market | 47 | from 42 |
July was already a soft month. The difference in August is that the one measure still holding the line finally gave way.
The number that matters, and it is not the average
The average price fell 3.5%. Set that aside for a moment, because the average is only the mean of whatever happened to sell, and it swings with the mix. The number that tells you what a house is worth is the MLS Home Price Index, which prices a constant-quality benchmark home and strips the mix out.
The composite benchmark is $378,700. Year over year, still up 4.4%. Read the headline and you would think nothing much happened.
Now read the rest of the row.
Down 1.5% from July. Down 6.3% from three months ago. Down 4.6% from six months ago.
In July the benchmark was still inching up month over month, at plus 0.1%. This month it did not. Three months ago the benchmark sat around $404,000, which means roughly $25,000 has come off since the spring. Against a year ago you are still ahead by about $16,000. Against May you are not.
Nothing in that row is a crash. But it is now negative across every window shorter than a year, and the year-over-year figure most reports lead with is a rear-view mirror. It is measuring a market that no longer exists.
If you listed this spring and you are still sitting there
Your price was probably right in May. The question is what it is worth against the homes actually selling this month, and that is a different number. It takes about a minute to find out.
One address. For a closer read on your street or property type, Candace McKay answers directly.
Fewest sales in the series, second-most new listings
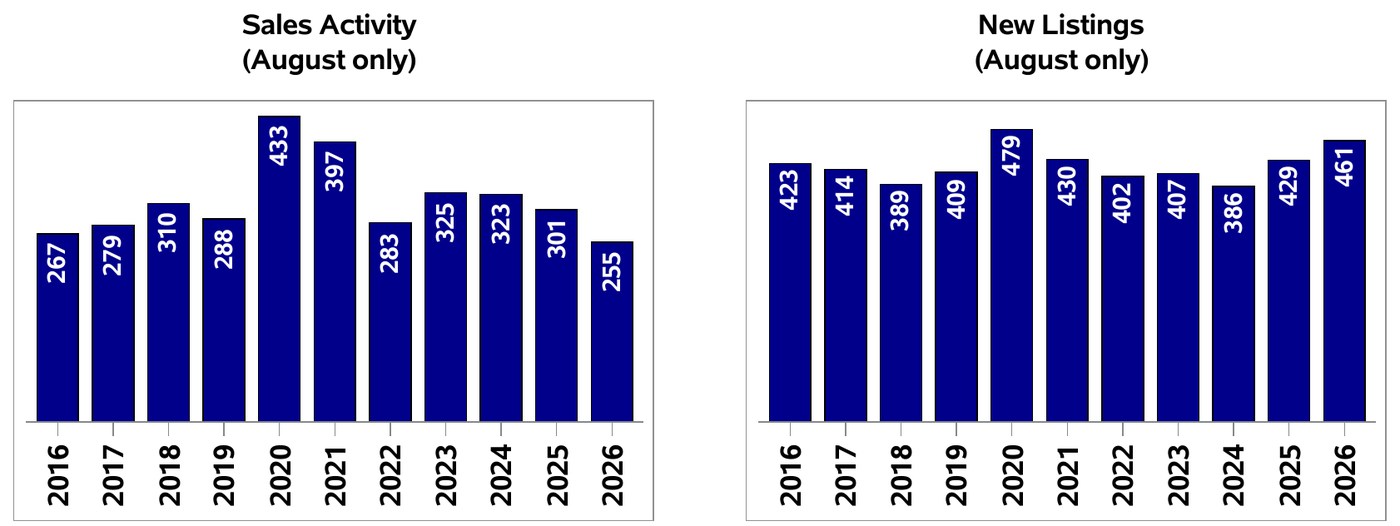
Sales fell to 255, the lowest August in the series, while new listings reached 461, second only to 2020. Chart: CREA and the New Brunswick REALTORS.
Put the two bars beside each other and the squeeze is obvious. 2020 is the only August with more new listings than this one, and that August produced 433 sales. This August produced 255.
The sales-to-new-listings ratio landed at 55.3, down from 70.2 a year ago. By the usual industry reading, the 40 to 60 band is balanced and below 40 is buyer territory. We are not there. We are moving that way at a fairly deliberate pace.
Six point two months
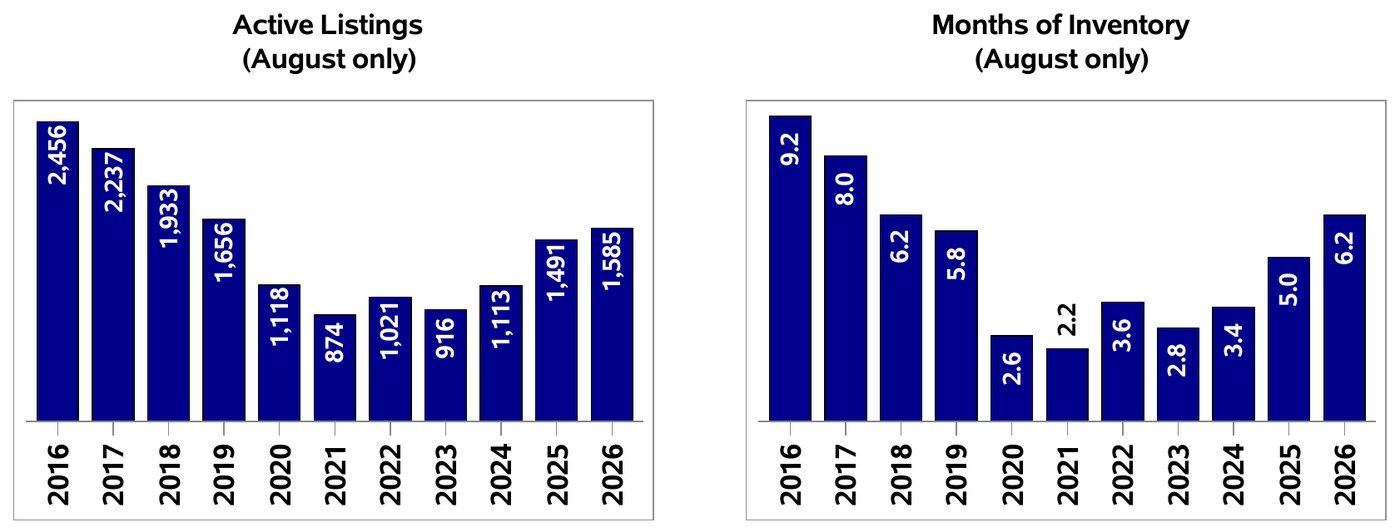
Active listings reached 1,585 and months of inventory hit 6.2, matching 2018 and more than double the 2.6 reading of 2020. Chart: CREA and the New Brunswick REALTORS.
Months of inventory is the cleanest single measure of who holds the leverage. It answers how long it would take to sell everything currently listed at the current pace. In August 2021 the answer was 2.2 months, and anyone who was buying then remembers what that felt like.
The answer now is 6.2 months. Same reading as August 2018, which is to say a normal, unremarkable Maritime market, the kind where a well-priced house sells and an overpriced one sits until Christmas.
Active listings at 1,585 are the highest for an August since 2019. They are also about 35% below 2016. This is a market normalising from an extreme, not one collapsing.
Normalising is still uncomfortable if your pricing expectations were set in 2022.
The detached market is carrying almost all of the weakness
Here is the part of the release nobody else in this market will report, and it is the most useful thing in it.
Strip the region into its property types and the drop in sales volume is not evenly spread. It is concentrated almost entirely in single detached homes. Prices are a separate question, and we will get to those.
| Property type | Sales, Jan to Aug | Vs 2025 | Months of inventory |
|---|---|---|---|
| Semi-detached | 338 | +28.5% | 3.2 |
| Townhouse | 119 | +11.2% | 6.6 |
| All property types | 2,129 | −6.4% | 6.2 |
| Single detached | 1,536 | −12.4% | 6.2 |
Months of inventory is the August reading. Sales are year to date. Apartments are excluded from this table because the segment recorded only 19 sales in eight months.
Single detached sales are down 12.4% year to date while the market as a whole is down 6.4%. In August alone, detached sales fell 24.1% to 176, the lowest August that segment has recorded in the eleven-year series.
Semi-detached sales are up 28.5% year to date. Two things are true about that. Last year was a weak base for the segment, so the percentage flatters it. And new semi listings are up 15.7% over the same eight months while sales grew faster still, pushing the year-to-date sales-to-new-listings ratio from 61.7 to 68.6. Supply rose and demand outran it. At 3.2 months of inventory in August, roughly half the market reading, semi-detached is the tightest thing in Greater Moncton right now.
One detail worth sitting with: the median semi-detached home sold for $364,000 in August. The median single detached sold for $348,700. The attached home fetched more than the freestanding one.
Be careful how you read that. It is a mix effect, not a valuation. The benchmark still says a comparable detached home is worth $387,900 against $372,000 for a comparable semi. What the medians are telling you is not that semis are now worth more, it is that the detached homes still transacting have shifted toward the lower end of that segment while semis are trading closer to the top of theirs.
Which is the real point. Total sales fell 15.3%, so some demand did leave the market outright. But what remains is not spread evenly. It has concentrated in the attached segment, and detached listings are the ones sitting.
Where the benchmark sits by property type
| Property type | Benchmark | Vs 12 months | Vs 3 months |
|---|---|---|---|
| Townhouse | $278,400 | +17.5% | −1.0% |
| Semi-detached | $372,000 | +5.4% | −4.8% |
| Composite | $378,700 | +4.4% | −6.3% |
| Single detached | $387,900 | +4.3% | −6.3% |
| Apartment | $313,800 | −2.2% | −9.9% |
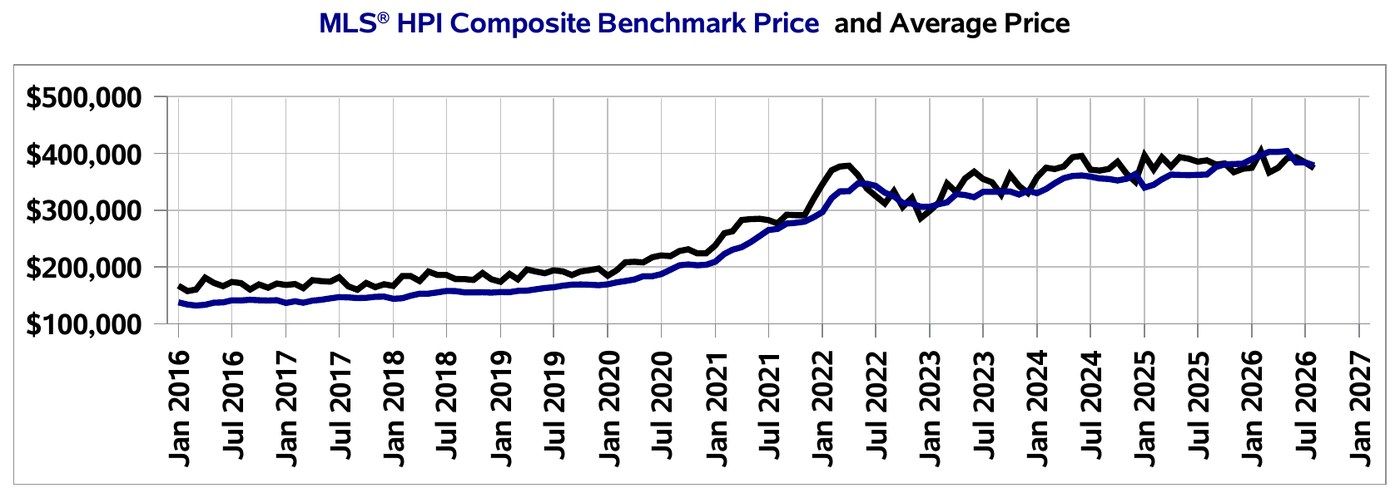
The benchmark, in blue, runs smoother than the average, in black, because it holds quality constant. Both finish the series below their 2026 highs. Chart: CREA and the New Brunswick REALTORS.
Two honest caveats on that table, because they matter more than the numbers look.
The apartment segment recorded two sales in August and nineteen so far this year. Its months of inventory reads 18.5, which is 37 active listings divided by those two sales. Any percentage built on two transactions is noise. Treat the whole apartment line as directional at best.
Townhouse deserves a caution too. The benchmark is up 17.5% on the year, the strongest number in the release, but the segment sold 13 homes in August and carries 6.6 months of inventory, looser than the market as a whole. Strong index, thin and slow market underneath it. Do not build a decision on that line alone.
What this means for Moncton and area
Greater Moncton spent five years as one of the tightest housing markets in the country. That period is over. What comes next is more interesting than the panic version.
Supply caught up, and it is not stopping. New listings are running at the second-highest August level in eleven years while sales run at the lowest. That gap is not a one-month event. Add the volume of housing under construction across the region, from the Riverview secondary plan to the Dieppe Boulevard corridor and the broader construction pipeline, and the supply side of this market has real momentum behind it going into 2027.
The correction is specific, not general. Detached sales down 12.4% year to date, 6.2 months of inventory, benchmark off 6.3% in a quarter. If your equity sits in a single detached home in Moncton, Dieppe or Riverview, that is your market and it has softened materially since May. Semi-detached is softer on price than it was but still clearing at 3.2 months, which is a very different position to negotiate from.
Nothing here resembles 2008. The benchmark is still above last year. Inventory is about 35% below 2016. The sale-to-list ratio is 96.6%, meaning the average sale closed within 3.4% of asking, roughly $13,000 on an implied list price near $387,000. Sellers are conceding, not capitulating. This is a rebalancing toward buyers after five years of the opposite, and rebalancing is healthy even when it is unpleasant for whoever is holding the listing.
The fall is the thing to watch. September through November is when unsold spring inventory either reprices or comes off the market. If active listings keep climbing while sales stay near record lows, 6.2 months becomes 7 and the negotiating range widens further. That is the number we will be watching on the next release, and we will report it the same way whether it improves or not.
If you are selling right now
Price to August, not to May. That is the whole instruction, and most of the stale inventory in this region is failing it.
Your neighbour's spring sale is no longer a comparable. For detached homes the benchmark is 6.3% below where it stood three months ago, and the buyer looking at your house has close to 1,100 other detached listings to consider and no reason to hurry. Listing 5% high in this market does not open a negotiation. It buys you six weeks of quiet and then a price reduction that reads as weakness.
Three things worth doing before you list this fall.
Get a valuation built on homes that sold in the last thirty days, not the last six months. When the benchmark can move 6% in a quarter, six-month comparables are not conservative, they are wrong.
Price at or just under the benchmark for your property type and take your negotiation from a position of activity. In our experience a listing that generates real showings in the first ten days keeps its pricing power. One that goes quiet is negotiating from behind, and the longer it sits the more that costs.
If you own a semi and you have been waiting, look hard at this fall. Your segment is the exception in this data. Semi-detached at 3.2 months of inventory and a 94.2 sales-to-new-listings ratio in August is a genuinely different position from the detached market, and there is no guarantee it holds through 2027 as new supply completes. Worth knowing before you decide: semis are taking longer to sell than detached homes right now, a median of 53 days against 47, and the segment's sale-to-list ratio slipped from 99.2% to 97.9%. Strong demand, but not the frenzy of two years ago.
If you are buying right now
This is the most leverage buyers have had in Greater Moncton since 2018. It is worth being direct about how to use it.
You have time. Six months of inventory means you can see a house twice, get an inspection, and sleep on it before deciding. That was not true in 2021 and it is the single biggest change in this market.
You have room on price. The average sale closed 3.4% under asking and that gap has widened over the year. On a stale listing, particularly a detached home that has been sitting since spring, the real range is wider than the average suggests.
Do not wait for the average price to tell you when to move. It is the noisiest number in the release and it moves with mix, not value. Watch the benchmark for the property type you actually want, and watch months of inventory for that type. Detached at 6.2 months is your opportunity. Semi-detached at 3.2 months is not, and if that is what you want, you are still competing for it.
One thing to be clear-eyed about. A softening benchmark is not a reason to sit out indefinitely, because the conditions that handed you this leverage will not survive the next supply and rate cycle. The better question is not whether prices go lower. It is whether you can buy well right now against a seller whose timeline is running out. In the detached market this fall, a lot of them are.
How we can help
A regional benchmark tells you what happened to the market. It does not tell you what happened to your street, your property type or your price band, and in a release where one segment is down 12% on the year while another is up 28%, that difference is worth real money in either direction.
Find out where your home actually sits
Selling this fall, we price against the last thirty days of comparable sales in your area, not against a regional average. Buying, we will show you which listings have real motivation behind them and which sellers are still anchored to the spring.
Or reach out to Candace McKay for a read on your specific street, property type and timeline.
Full tables, year-to-date figures and the complete benchmark series by property type are on our Moncton average home price page, updated with every monthly release.
Source: Moncton and Area Residential Market Activity and MLS Home Price Index Report, August 2026, prepared for the New Brunswick REALTORS by the Canadian Real Estate Association. Figures cover the Moncton and Area board region, which includes Moncton, Dieppe, Riverview and surrounding communities. The package reports the region as a single market and contains no municipal breakdown. Historical comparisons cover 2016 to 2026, the full range published in the release.
Categories
Recent Posts