Moncton & Area Real Estate Market Update February 2026
Moncton & Area Real Estate Market Update
February 2026
Published: March 4, 2026 | Data: CREA MLS® Systems | By: Joel Langlois, REALTOR®
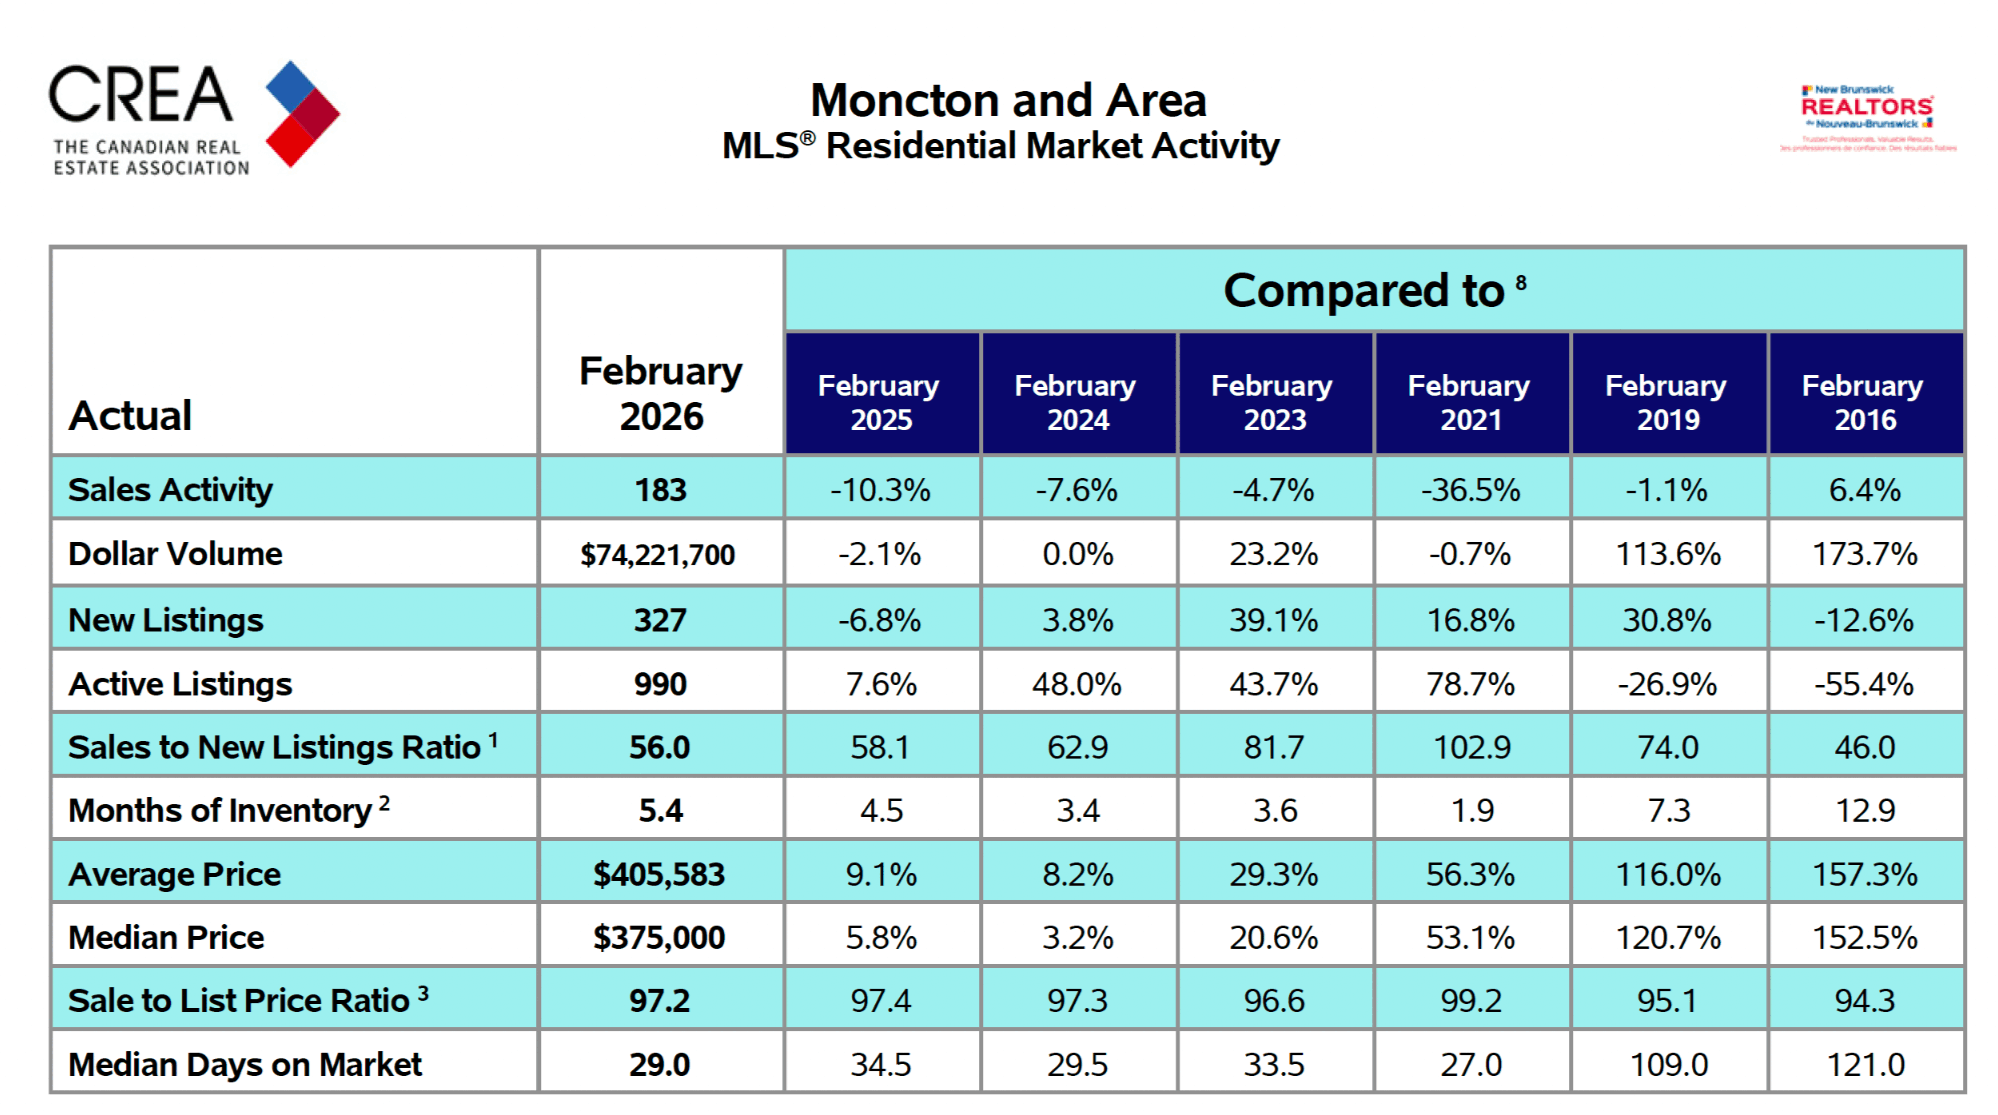
The February 2026 data out of Moncton and area requires careful reading. Transaction volume declined year-over-year, but the average sale price crossed $405,000 for the first time on record in this market. Supply is building from historic lows, but months of inventory remains near balanced territory at 5.4 (Quite elevated). Homes are selling in 29 days at 97.2 cents on the asking dollar.
This is not a market in retreat. It is a market normalizing after an extraordinary four-year run, settling into a rhythm that reflects structurally tighter supply, sustained demand, and a price floor that continues to hold. What follows is a full breakdown of every key metric, what it means, and what it implies for buyers and sellers operating in this market today.
Looking for a snapshot of current listings? Browse active properties in the Moncton area, or visit the market reports archive for the full trend picture.
February 2026: Key Metrics at a Glance
Sales Activity: Fewer Transactions, Not a Broken Market
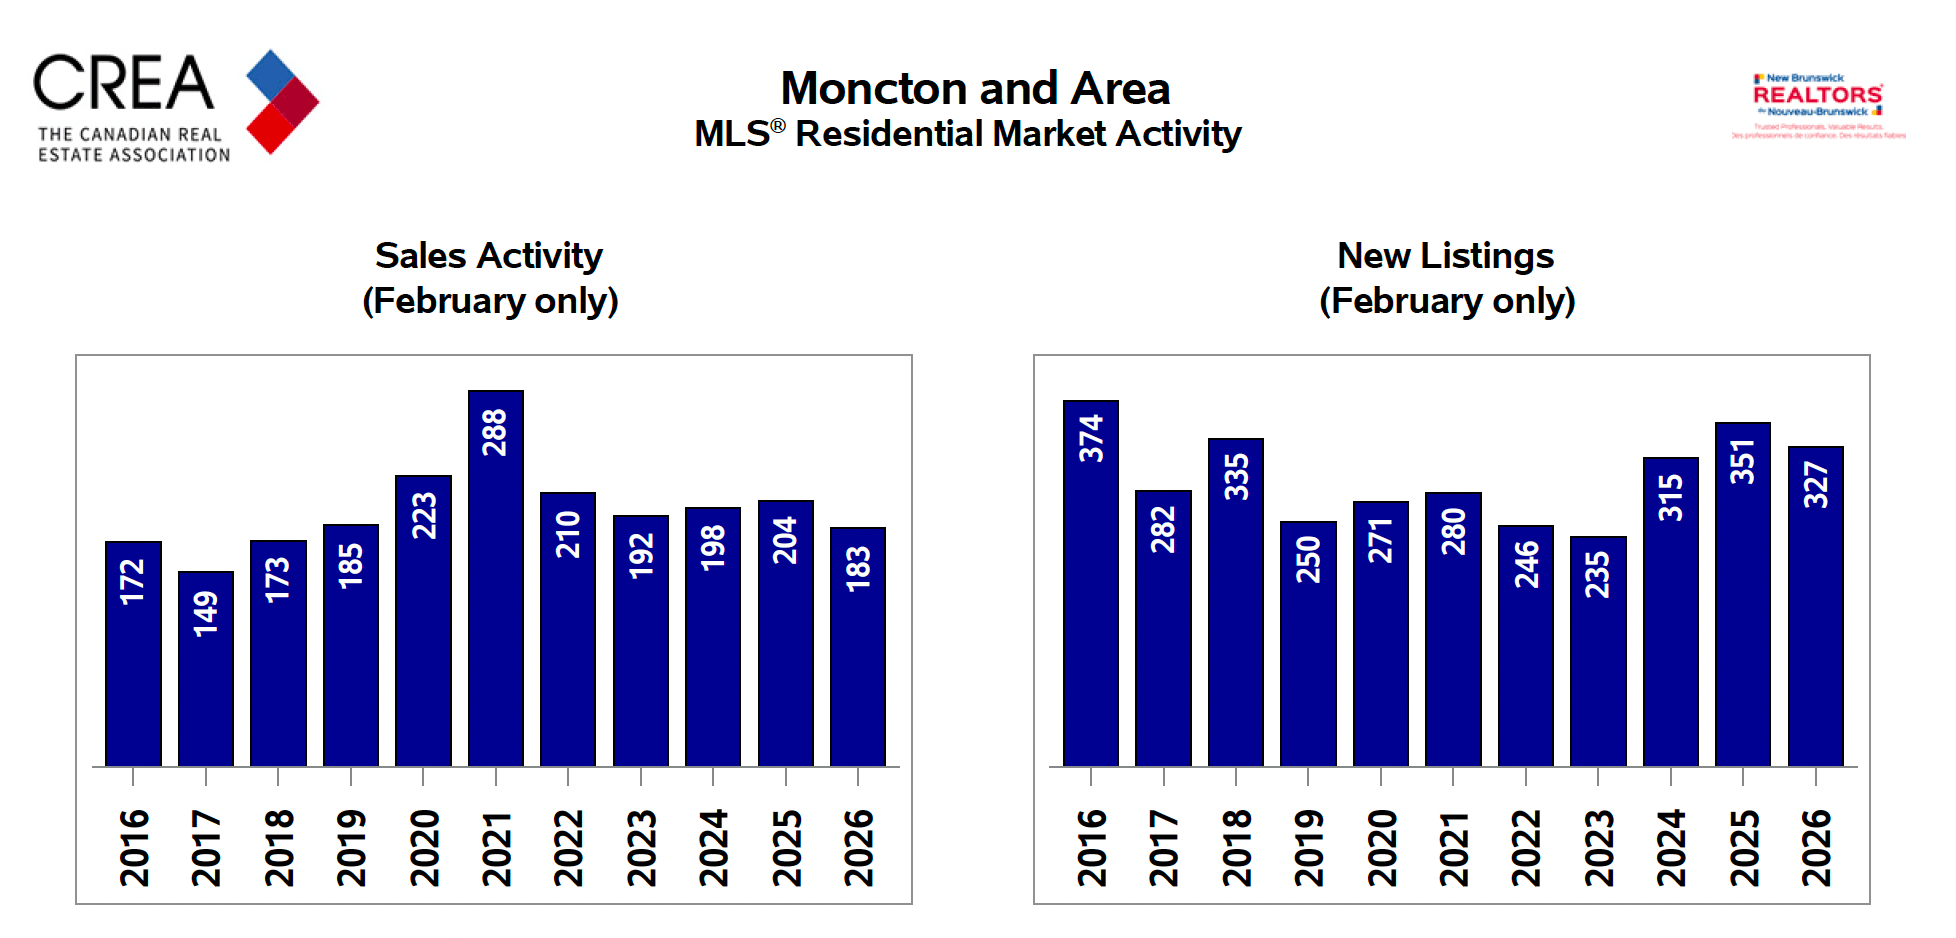
February 2026 recorded 183 residential sales across the Moncton and area board, a 10.3% decline from the 204 sales recorded in February 2025. On the surface, that raises a flag. In context, it tells a different story.
The 10-year chart is instructive. February sales from 2016 through 2020 ranged between 149 and 185 transactions. The 2021 peak of 238 sales and the subsequent 210 in 2022 were the anomalies, fuelled by record-low rates, pandemic-driven migration, and compressed demand playing out in 18 months of buying urgency. What we are seeing now is a return to baseline, not a retreat.
183 sales is a functional February. It sits within the normal pre-pandemic range, and the dollar volume of $74.2 million reflects transactions happening at meaningfully higher price points than even two years ago.
Total dollar volume came in at $74,221,700, down a modest 2.1% from February 2025. That slight decline despite a 9.1% increase in average price confirms the volume story: fewer transactions are happening, but each one is carrying significantly more value. New listings added 327 properties to the market, down 6.8% from the same month last year. The supply side is not flooding the market, which partially explains why pricing remains firm despite softer demand.
Pricing: The $405,000 Milestone
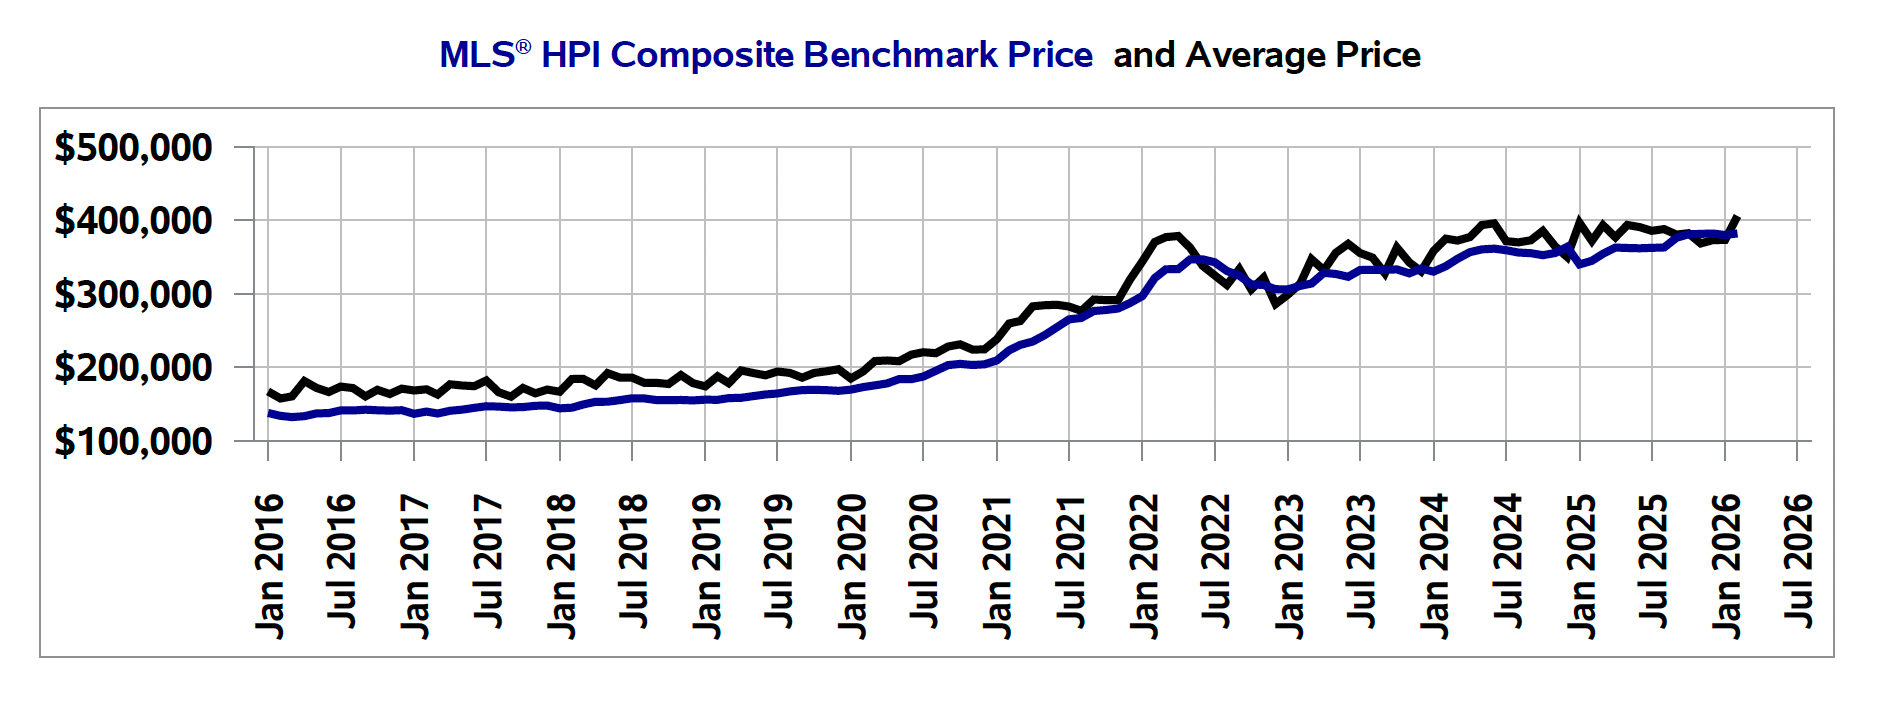
The average sale price in February 2026 reached $405,583, a 9.1% increase from February 2025 and the highest February average this market has ever recorded. The median sale price hit $375,000, up 5.8% year-over-year.
The spread between average ($405,583) and median ($375,000) is a useful signal. When the average materially exceeds the median, it reflects activity in the upper price bands pulling the mean higher. This is not a broad speculative spike. It reflects genuine demand concentrated on a thinning supply of single detached and higher-end properties where pricing power remains firmly with sellers.
The 10-year price chart tells the full structural story. In early 2016, the average price in this market was approximately $158,000. Today it sits at $405,583. That is price appreciation of 157% over a decade, and the trajectory has not reversed. There was modest consolidation from the 2022 peak through 2023, but the long-term trend line remains intact and prices are now pushing to new highs.
For homeowners who purchased between 2016 and 2020, this represents substantial equity accumulation. For buyers entering today, the relevant question is whether the current price level is a ceiling or a landing. Based on supply and demographic fundamentals, the evidence strongly supports the latter.
Want to know what your property is worth at today’s prices? Request a free home valuation.
Supply: Inventory Building, But Context Is Everything
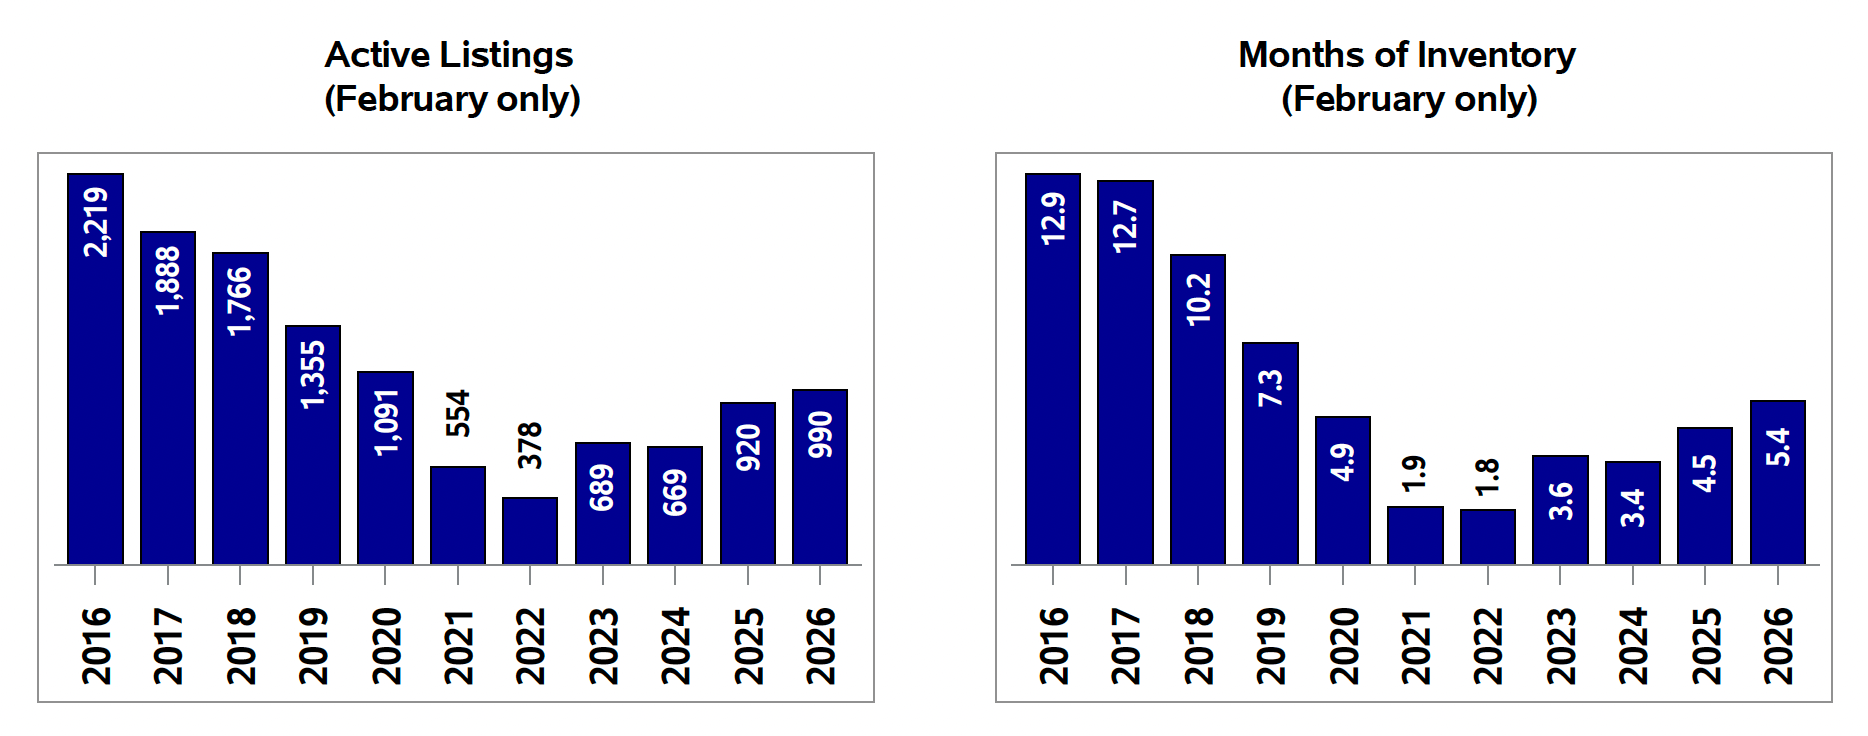
Active listings stood at 990 at the end of February 2026, up 7.6% from the same period last year. Directionally, this is a meaningful shift. The market is adding supply back into a system that was running critically thin.
But proportion matters enormously here. In February 2016, there were 2,219 active listings in this market. The current level of 990 represents less than half that historical baseline. The inventory chart is unambiguous: active listings compressed from over 2,200 to a floor of 378 in 2022, and have been climbing gradually since. At 990, we are still well below any reasonable definition of oversupply.
Months of inventory, the single most important supply-demand ratio in residential real estate, came in at 5.4 months, up from 4.5 in February 2025 and directionally trending toward balanced market territory (typically defined as 4 to 6 months). At 5.4 months with prices still appreciating at 9.1% year-over-year, this market is not yet buyer-friendly enough to give purchasers meaningful negotiating leverage.
The 10-year months of inventory chart is perhaps the most telling single data point in this report. February 2016 sat at 12.9 months, a deeply buyer-favourable market. By February 2022, that had compressed to 1.8 months, an extraordinarily seller-dominated environment. February 2026 at 5.4 months represents a market that has normalized, but that normalization is tilted toward seller advantage, not buyer advantage.
Market Velocity: Homes Are Still Moving Fast
Speed is the most useful real-time proxy for competitive intensity, and February 2026 was a fast market. The median days on market came in at 29 days, down from 34.5 days in February 2025. That is a 16% improvement in sell speed year-over-year, a counterintuitive result given the volume decline.
The January-to-February comparison tells the seasonal story. In January 2026, the median days on market was 67 days. In February, it dropped to 29. This sharp acceleration reflects buyers who had been sitting on the sidelines through the holiday period entering the market in force through late January and February. It is a pattern that typically continues to tighten through the spring selling season.
The sale-to-list price ratio held at 97.2%, nearly identical to the 97.4% recorded last February. Sellers in this market are consistently realizing 97 cents on every dollar of asking price. In historical context (91.5% in February 2016, 94.1% in February 2019), this reflects how much pricing power remains on the sell side. A 97.2% sale-to-list ratio in a market with 5.4 months of inventory is a strong outcome for sellers.
Year-to-Date: The First Two Months in Context
[ INSERT IMAGE: Moncton-Area-February-2026-Year-to-Date-Stats.png ]
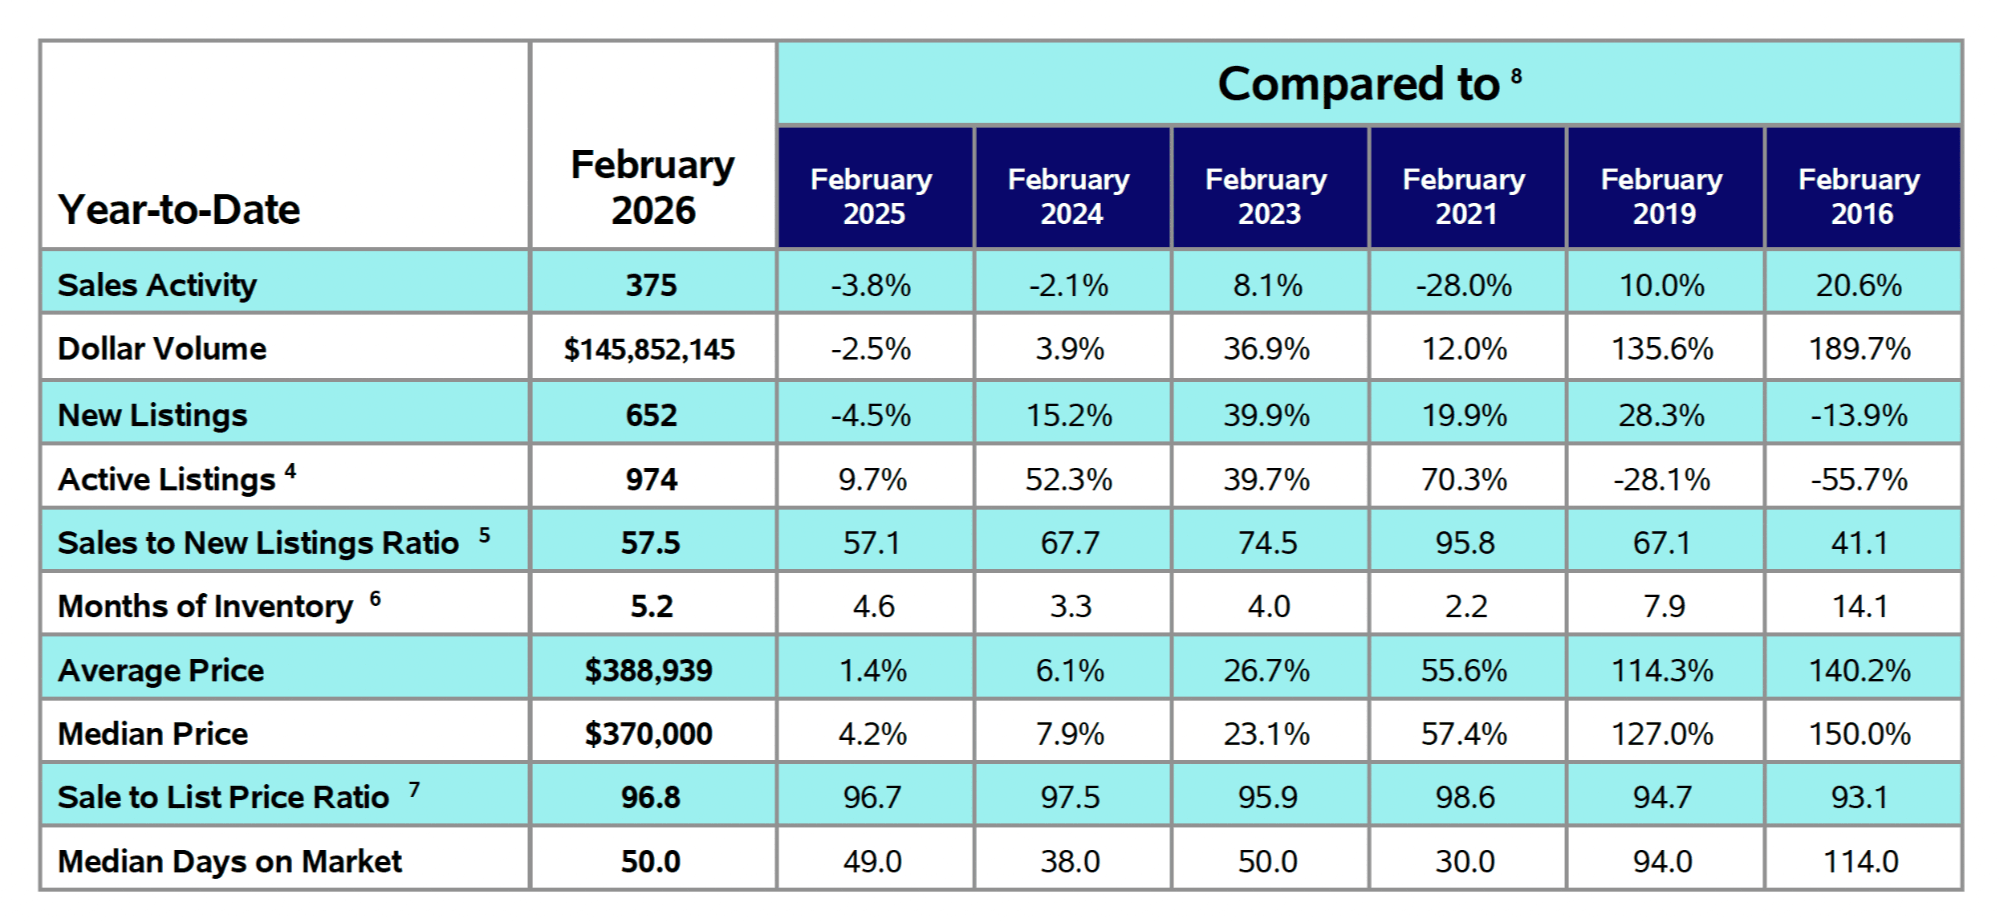
Through the first two months of 2026, the Moncton and area market recorded 375 total sales, down 3.8% from the same period in 2025. Total dollar volume was $145,852,145, a 2.5% decline year-over-year.
The year-to-date average price sits at $388,939, up only 1.4% for the period. That modest YTD gain masks the momentum building within it. January 2026 pulled the average down (average price was $373,997 in January, down 5.6% from January 2025). February’s $405,583 average represents a strong recovery, and the month-over-month price jump from $374K in January to $406K in February, an 8.5% gain in a single month, is the most significant data point in this entire report. The price floor found in January was exactly that: a floor.
Year-to-date median price of $370,000 reflects a 4.2% gain. The YTD sale-to-list ratio of 96.8% and median days on market of 50 days are both heavily weighted by January’s slower pace. As spring progresses, both of those figures will tighten toward the faster February pace.
YTD new listings came in at 652, down 4.5% from last year. Active listings are up 9.7% year-to-date. The inventory build is real and directionally constructive for buyers, but it is not translating into pricing softness at the aggregate level.
The 10-Year View: Structural Shift, Not a Cycle
The decade of data now available for this market is worth sitting with carefully. In February 2016: 172 sales, 2,219 active listings, and an average price around $158,000. In February 2026: 183 sales, 990 active listings, and an average price of $405,583.
Transaction volume is essentially flat over 10 years. Supply has been cut by more than half. Price has more than doubled. This is the mathematical outcome of structural undersupply meeting sustained and growing demand, and it did not happen because of a speculative bubble. It happened because Moncton became a legitimate destination: affordable by national standards, growing in population, adding employment and infrastructure, and attracting interprovincial buyers from Ontario and British Columbia where comparable properties were priced two to three times higher.
The structural drivers that created this decade of appreciation have not reversed. Population growth in the greater Moncton area continues. New housing completions remain insufficient to absorb demand at the rate required. And with active listings still less than half their 2016 levels, the supply deficit is not a short-term anomaly. It is a persistent structural condition.
None of this precludes cyclical softness in transaction volume or price plateaus in specific segments. But it does mean that anyone waiting for a significant correction as a buying strategy is taking on meaningful opportunity cost in a market where structural tailwinds remain intact.
What This Means for Buyers and Sellers
If You Are Selling
This is still a seller’s market by every meaningful metric, but the degree of advantage has narrowed from the extreme conditions of 2021-2022. Pricing correctly matters more than it did three years ago. At 97.2% sale-to-list and 29 median days on market, correctly-priced properties are moving efficiently. Overpriced listings accumulate days on market, which creates negotiating liability and typically results in price reductions that land the seller below where a well-priced initial listing would have closed.
The January-to-February price jump signals that spring momentum is building. Sellers who list in March and April are entering the market as buyer activity accelerates, which is the optimal timing position. Waiting until summer introduces competitive risk as more listings come to market.
Want a current market analysis before listing? Request a free comparative market analysis, or explore the seller resources page for a breakdown of the listing process.
If You Are Buying
More active listings than at any point since 2022 means more selection and less panic. The multiple-offer, waive-conditions environment of 2021-2022 is not universally present in the same way. With 5.4 months of inventory, buyers have time to conduct proper due diligence, and there is genuine choice in the market.
That said, the price data argues against a wait-and-see strategy. Prices are up 9.1% from last February. The month-over-month acceleration from January to February alone was 8.5%. Buyers who have been sitting on pre-approvals through the winter are currently entering a market that is moving faster by the week. The spring window historically concentrates competition.
New to the Moncton market or relocating from out of province? Visit the buyer resources section for an overview of the process, or contact Joel directly to discuss your specific search criteria and price range.
Bottom Line
February 2026 delivered a market that is simultaneously softer on transaction volume and stronger on price than a surface-level reading would suggest. That combination, fewer deals, record-high average prices, fast sell times, and a near-unchanged sale-to-list ratio, is the signature of a supply-constrained market absorbing a cooling in buyer urgency without losing its structural pricing support.
The Moncton and area market is not back to 2021 conditions, and it does not need to be. The price level has reset permanently higher, the supply floor is demonstrably below historical norms, and the population and economic fundamentals that drove the 2019-2024 run remain intact.
What the February data does not show is any indication of a correction. Months of inventory at 5.4. Prices up 9.1%. Homes selling in 29 days at 97 cents on the dollar. Those are not correction metrics.
Thinking about buying or selling in Greater Moncton? I publish market updates every month backed by real data, not headlines. If you want a personalized market analysis for your neighbourhood or property, book a quick call and I will walk you through what the numbers mean for your situation.
Book a Call with Joel | Get Your Free Home Value

Joel Langlois | Moncton Real Estate
Local expertise • Data-driven pricing • Strategic marketing
Disclaimer
All data sourced from the Canadian Real Estate Association (CREA) and New Brunswick REALTORS® MLS® Systems. Market data reflects the Moncton and Area real estate board. Statistics are based on MLS® activity and represent the full data set collected on the first calendar day of the reporting month. Past performance is not indicative of future market conditions. This report is for informational purposes only and does not constitute financial or investment advice.
Categories
Recent Posts